UNITED STATES
SECURITIES AND EXCHANGE COMMISSION
Washington, D.C. 20549
________________________________________________________________
FORM 10-K
________________________________________________________________
(Mark One)
| |
ý | ANNUAL REPORT UNDER SECTION 13 OR 15(d) OF THE SECURITIES EXCHANGE ACT OF 1934 For the fiscal year ended December 31, 2016 |
OR
o TRANSITION REPORT UNDER SECTION 13 OR 15(d) OF THE SECURITIES EXCHANGE ACT OF 1934
For the transition period from to
Commission File Number 001-36216
________________________________________________________________
IDEAL POWER INC.
(Exact name of registrant as specified in its charter)
________________________________________________________________
|
| | |
DELAWARE | | 14-1999058 |
(State or other jurisdiction of incorporation or organization) | | (I.R.S. Employer Identification No.) |
4120 Freidrich Lane, Suite 100
Austin, Texas 78744
(Address of principal executive offices)
(512) 264-1542
(Registrant’s telephone number, including area code)
Securities registered pursuant to Section 12(b) of the Act:
|
| | |
Title of each class | | Name of each exchange on which each is registered |
Common Stock, par value $0.001 | | NASDAQ Capital Market |
Indicate by check mark if the registrant is a well-known seasoned issuer, as defined in Rule 405 of the Securities Act. Yes o No ý
Indicate by check mark if the registrant is not required to file reports pursuant to Section 13 or Section 15(d) of the Act. Yes o No ý
Indicate by check mark whether the registrant (1) has filed all reports required to be filed by Section 13 or 15(d) of the Securities Exchange Act of 1934 during the preceding 12 months (or for such shorter period that the registrant was required to file such reports); and (2) has been subject to such filing requirements for the past 90 days. Yes ý No o
Indicate by check mark whether the registrant has submitted electronically and posted on its corporate Web site, if any, every Interactive Data File required to be submitted and posted pursuant to Rule 405 of Regulation S-T (§229.405 of this chapter) during the preceding 12 months (or for such shorter period that the registrant was required to submit and post such files). Yes ý No o
Indicate by check mark if disclosure of delinquent filers pursuant to Item 405 of Regulation S-K is not contained herein, and will not be contained, to the best of registrant’s knowledge, in definitive proxy or information statements incorporated by reference in Part III of this Form 10-K or any amendment to this Form 10-K. ý
Indicate by check mark whether the registrant is a large accelerated filer, an accelerated filer, a non-accelerated filer, or a smaller reporting company. |
| | |
Large accelerated filer o | | Accelerated filer o |
Non-accelerated filer o | | Smaller reporting company ý |
(Do not check if a smaller reporting company) | | |
Indicate by check mark whether the issuer is a shell company (as defined in Rule 12b-2 of the Exchange Act). Yes o No ý
State the aggregate market value of the voting and non-voting common equity held by non-affiliates computed by reference to the price at which the common equity was last sold, or the average bid and asked price of such common equity, as of the last business day of the registrant’s most recently completed second fiscal quarter.
As of June 30, 2016, the aggregate market value of the voting and non-voting common equity held by non-affiliates computed by reference to the last sale price of the common equity was $35,944,832. As of March 20, 2017 the issuer has 13,996,782 shares of common stock, par value $0.001, outstanding.
DOCUMENTS INCORPORATED BY REFERENCE
The information required by Part III of this Report, to the extent not set forth herein, is incorporated herein by reference from the Proxy Statement relating to the registrant’s 2017 annual meeting of stockholders, which shall be filed with the Securities and Exchange Commission within 120 days after the end of the fiscal year to which this Report relates.
TABLE OF CONTENTS
|
| |
| |
PART I. | |
| |
| |
| |
| |
| |
| |
PART II. | |
| |
| |
| |
| |
| |
| |
| |
| |
PART III. | |
| |
| |
| |
| |
| |
PART IV. | |
| |
Signatures | |
SPECIAL NOTE REGARDING FORWARD-LOOKING STATEMENTS AND
OTHER INFORMATION CONTAINED IN THIS REPORT
This report contains forward-looking statements within the meaning of the Private Securities Litigation Reform Act of 1995 and the provisions of Section 27A of the Securities Act of 1933, as amended, and Section 21E of the Securities Exchange Act of 1934, as amended. Forward-looking statements give our current expectations or forecasts of future events. You can identify these statements by the fact that they do not relate strictly to historical or current facts. You can find many (but not all) of these statements by looking for words such as "approximates," "believes," "hopes," "expects," "anticipates," "estimates," "projects," "intends," "plans," "would," "should," "could," "may" or other similar expressions in this report. In particular, these include statements relating to future actions, prospective products, applications, customers, technologies, future performance or results of anticipated products, expenses, and financial results. These forward-looking statements are subject to certain risks and uncertainties that could cause actual results to differ materially from our historical experience and our present expectations or projections. Factors that could cause actual results to differ from those discussed in the forward-looking statements include, but are not limited to:
| |
• | our ability to achieve profitability; |
| |
• | our limited operating history; |
| |
• | our ability to successfully market and sell our products; |
| |
• | the size and growth of markets for our current and future products; |
| |
• | our expectations regarding the growth and expansion of our customer base; |
| |
• | regulatory developments that may affect our business; |
| |
• | our ability to successfully develop new technologies, including our bi-directional bipolar junction transistor, or B-TRAN™; |
| |
• | our expectations regarding the completion of testing of new products under development and the timing of the introduction of those new products; |
| |
• | the expected performance of new products incorporating our B-TRAN™; |
| |
• | the performance of third-party manufacturers who supply and manufacture our products; |
| |
• | our ability to cost effectively manage product life cycles, inclusive of product launches and end of product life situations; |
| |
• | the rate and degree of market acceptance for our current and future products; |
| |
• | our ability to successfully obtain certification for our products, including in new markets, and the timing of the receipt of any necessary certifications; |
| |
• | our ability to successfully license our technology; |
| |
• | our ability to obtain, maintain, defend and enforce intellectual property rights protecting our current and future products; |
| |
• | our expectations regarding the decline in prices of battery energy storage systems; |
| |
• | general economic conditions and events and the impact they may have on us and our potential customers; |
| |
• | our ability to obtain adequate financing in the future, as and when we need it; |
| |
• | our success at managing the risks involved in the foregoing items; and |
| |
• | other factors discussed in this report. |
The forward-looking statements are based upon management’s beliefs and assumptions and are made as of the date of this report. We undertake no obligation to publicly update or revise any forward-looking statements included in this report. You should not place undue reliance on these forward-looking statements.
PART I
ITEM 1: BUSINESS
Our Company
Ideal Power Inc. was formed in Texas on May 17, 2007 and converted to a Delaware corporation on July 15, 2013. Unless otherwise stated or the context otherwise requires, the terms "Ideal Power," "we," "us," "our" and the "Company" refer to Ideal Power Inc.
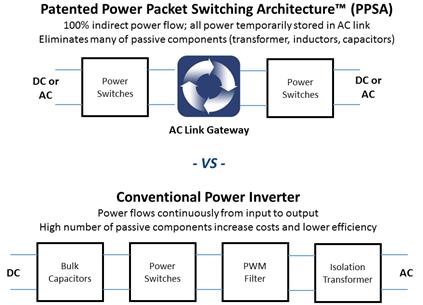
We design, market and sell electrical power conversion products using our proprietary technology called Power Packet Switching Architecture™, or PPSA™. PPSA™ is a power conversion technology that improves upon existing power conversion technologies in key product metrics, such as size and weight while providing built-in isolation and bi-directional and multi-port capabilities. PPSA™ utilizes standardized hardware with application specific embedded software. Our advanced technology is important to our business and we make significant investments in research and development and protection of our intellectual property. At December 31, 2016, we have been granted 32 US patents and six foreign patents related to PPSA™.
We sell our products primarily to systems integrators for inclusion in larger turn-key systems which enable end users to manage their electricity consumption by reducing demand charges or fossil fuel consumption, integrating renewable energy sources and forming their own microgrid. Our products are made by contract manufacturers to our specifications, enabling us to scale production to meet demand on a cost-effective basis without requiring significant expenditures on manufacturing facilities and equipment. As our products establish a foothold in key power conversion markets, we may begin to focus on licensing our proprietary PPSA™-based product designs to OEMs to reach more markets and customers. We may seek to build a portfolio of relationships that generate license fees and royalties from OEMs for sales of their products which integrate PPSA™.
Industry Background
Utility power grids are built using alternating current, or AC, generation, transmission, and distribution resources. This method of power transmission and distribution has been proven over time to be reliable and safe. The outlets in a typical home or business are AC but many electrical devices, such as computers, televisions, and other appliances operate on direct current, or DC, power. Batteries and photovoltaic, or PV, solar panels produce DC power as well. In order to connect DC devices to an AC power grid, a power conversion device is necessary.
We believe that significant changes in the supply of and demand for electrical power are driving demand for new energy infrastructure products and supporting technologies. In a traditional utility model, electrical power is generated from central stations and transmitted over long distance high-voltage transmission lines to substations where the voltage is reduced for distribution to consumers. Utility power grids are built to manage the flow of power in one direction, from generation to use, where sophisticated tools have been developed to match the amount of power being generated with the amount being consumed. Utilities ramp power plants up or down to closely match generation with load.
The rapid growth in worldwide renewable energy generation, such as wind and solar power, has added a new level of complexity to the task of matching power generation with consumption. These intermittent resources cannot be dispatched at will or relied upon to meet the peak power demands of the grid. Renewable energy sources tend to ramp up and down quickly. For example, a single cloud over a PV farm can cause electrical output to change dramatically in a matter of seconds. These new challenges make it increasingly difficult for utilities to accurately forecast and meet peak power demands.
Increased peak demand for power also has exposed weaknesses in the existing power grid. In high-cost, high-demand states, such as California, public utilities have instituted peak demand charges as a way to ration power during periods of peak demand and to incentivize customers to shift their power consumption to off-peak times. At the same time, both the Federal and certain state governments have created incentive programs to encourage the development and implementation of alternative energy sources, such as solar and wind power, which has the adverse consequence of making peak demand more difficult to forecast and satisfy. Strains on the electric grid have resulted in significant brown-outs and black-outs that have heightened awareness of the vulnerabilities of the existing system. As a result, power consumers are turning to new technologies to manage their energy consumption, lower costs and assure a reliable source of supply. We believe that distributed generation with advanced power conversion systems, such as our PPSA™ products, is becoming an increasingly important element of this new infrastructure.
In response to these changes in the market for electrical power, a number of technologies have been developed to enable users to more effectively manage their consumption and, one of these technologies, energy storage systems, has emerged as the best way to mitigate the instabilities and market inefficiencies caused by these emerging power grid realities. For example, a commercial business can shift energy usage from peak to non-peak times by installing a battery energy storage system, or BESS. The commercial business can use electricity generated during off-peak hours to charge the BESS and then use the stored power to satisfy all or part of its demand during peak hours. Similarly, a commercial business can install a solar power system to generate power for use either immediately upon generation or for storage in a BESS for later use.
Battery energy storage systems and many alternative energy sources provide power on a DC basis. However, the electric power grid and most electrical equipment operates on an AC basis. Consequently, power conversion systems are required to convert power from DC to AC or from AC or DC as necessary to make the various components of the system function together. In addition to converting power, power conversion systems enable customers to regulate current, voltage and frequency while optimizing system resources such as batteries, PV and the utility power grid to reduce energy costs. Systems incorporating advanced power converters may also manage distributed grid energy storage and be used to create stand-alone microgrids to bring power to a business or residence if the main electrical grid, if one is present, is unavailable.
Our Technology
PPSA™ uses indirect power flow in which power flows through input switches and is temporarily stored in our proprietary AC link inductor. Our proprietary fast switching algorithms enable the transfer of quantum packets of power between ports in our system. As the AC link becomes charged, it disconnects from its input switches, resonates without being connected to either the input or output switches, and then reconnects to its output switches when it reaches the correct voltage and frequency for the application.
Figure 1: Schematic of PPSA™ Process
Traditional power conversion systems use continuous power flow that relies on relatively heavy and expensive magnetic components and bulk capacitors. Many of these traditional systems have custom hardware for specific applications and are not readily adaptable or customizable. Because they are relatively inefficient, these systems generate excess heat that causes electrical and thermal stresses resulting in drive component failures and losses. By contrast, our conversion technology eliminates the majority of the passive components of traditional power conversion systems, including the separate isolation transformer and most of the inductors and bulk capacitors.
We believe PPSA™ offers several key advantages over traditional technologies, such as:
| |
• | Bi-directional: PPSA™ is inherently bi-directional enabling power flow in both directions. For example, one PPSA™-based power converter could be used to both charge and discharge batteries. |
| |
• | Built-in Isolation: PPSA™-based power converters have built-in isolation and thus do not require an isolation transformer which adds cost, size and weight and reduces the efficiency of battery energy storage systems. |
| |
• | Multi-Port Capabilities: PPSA™ architecture enables multiple AC and/or DC sources and uses to be connected together in one power converter, minimizing total system cost for tying together, for example, DC solar PV and DC batteries to the AC grid. |
| |
• | Scalability/Flexibility: PPSA™ is made from standard industry components, is battery agnostic and software driven, thus providing more scalability that enables rapid development cycles for new products and new applications. This same functionality provides ultimate flexibility for customers globally as it is capable of power conversion in both 50Hz and 60Hz AC environments. |
| |
• | Size and Weight: PPSA™ reduces size and weight by eliminating passive components such as isolation transformers, inductors and bulk capacitors. Reduced sized and weight result in lower transportation and installation costs. Our newest, fully isolated 30kW power conversion system weighs less than 150 pounds. By contrast, similar transformer-based 30kW power conversion systems typically weigh over 600 pounds. |
Products
We have developed products commercializing PPSA™ and make these products available for sale both directly to customers and through distributors. We currently sell several power conversion systems, or PCS, utilizing our patented PPSA™ technology. These products are described as follows:
| |
• | The 30kW SunDial™ and the 30kW SunDial Plus™, which are UL-1741 certified and are intended to be used for the commercial and industrial grid-tied solar and solar plus storage market. The SunDial™ is a PV string inverter which is field upgradable through the addition of a drop-in second DC port to connect batteries to a solar PV array. The SunDial Plus™ includes the PV inverter and the second DC battery port in one package. These products both include a built-in 6 string PV combiner and DC disconnects and are grid-tied, AC export only. |
| |
• | The 30kW Stabiliti™ series has two product offerings, two-port (AC-DC) and multi-port (AC-DC-DC) models, which are both UL-1741 certified. These products are intended to be used in the stand-alone storage and microgrid markets. They are bi-directional and operate in both grid-tied and grid-forming modes with near seamless transfer between operating modes. Grid-forming mode provides customers the ability to form and manage a microgrid. The products operate in both 50Hz and 60Hz environments and will be introduced in markets other than North America in 2017. |
| |
• | 125kW Grid-Resilient AC-DC PCS, which is certified for UL1741 conformance, has over four times the power of the 30kW product and is also able to convert in both 50Hz and 60Hz AC environments and form and manage a microgrid. This product is intended for use in higher power stand-alone storage and microgrid applications. |
Future Innovations
Bi-Directional Switches
Our existing products incorporate multiple insulated gate bipolar transistors (“IGBTs”), which are power switches used in the process to convert power from one current form to another. IGBTs switch power in only one direction (DC to AC or AC to DC) and require the use of a blocking diode to prevent power from flowing back through the system. To enable our existing products to perform bi-directional power conversion, for each IGBT and diode used in our products, we must include a second IGBT and diode. These additional components have slight voltage drops that affect the electrical efficiency of our products and generate excess heat that must be dissipated. We have patented and are developing a new, highly efficient silicon switch called a bi-directional bipolar transistor, or B-TRAN™, that we believe will allow us to substitute one B-TRAN™ for two pairs of IGBTs and diodes used in our current products and is also a potential replacement for conventional power switches in the broader power semiconductor market.
Based on third party device software simulations, we believe that the B-TRANs™ can significantly improve electrical efficiency in our power converters. The higher efficiency would substantially reduce the heat generated by the operation of our products. As a result, products incorporating B-TRANs™ will require less space for heat dissipation which would allow us to increase power density, or power per pound, and reduce material costs.
In April 2016, we announced one of our semiconductor fabricators successfully tested B-TRAN™ silicon dies and the results were consistent with third party simulations that predict significant performance and efficiency improvements over conventional power switches such as SCRs, IGBTs and MOSFETs. In October 2016, we announced one of our semiconductor fabricators successfully completed the fabrication of prototype B-TRAN™ devices. The next major milestone towards commercializing the B-TRAN™ will be to begin testing a fully-packaged device in the first half of 2017.
We plan to first utilize the B-TRAN™ in our own power conversion products and then introduce it into the rapidly growing power semiconductor market, estimated to be $19 billion in 2017 according to research firm IHS Technology, or IHS, utilizing a licensing model. We believe our new B-TRAN™ technology can potentially address a significant portion of the power semiconductor market that currently relies on power semiconductor devices such as technologies such as IGBTs. Potential addressable markets for B-TRAN™-based products include very low loss solid-state DC and AC contactors, electric vehicle drivetrains, variable frequency drives, solar PV inverters, bi-directional energy storage and microgrid power conversion systems, matrix converters and other power conversion products. At December 31, 2016, we have 18 US and five foreign issued patents covering the operation, control and manufacturing of the B-TRAN™ device.
EV Fast Chargers
Electric vehicles, or EVs, are emerging as a fast growth area of the overall automotive sector in the US and abroad. As EVs become a more significant section of the automotive market, the infrastructure to support them will need to be developed. Our PPSA™ technology is a natural power conversion choice for system integrators looking for a highly efficient and compact system for an DC EV fast charger. In 2017, we expect to begin the development of products based on our existing product family to directly target this fast-growing market segment.
Business Strategy
Our business strategy is to promote and expand the uses of PPSA™ initially through product development and product sales. To bring our products to market, we will seek out best-in-class partners who will distribute, white-label or integrate our innovative products into higher value systems resulting in multiple strategic sales channels for our PPSA™-based products and product designs. Although our primary market is the United States, we will increasingly target markets outside the United States. As our products gain broader acceptance in the power conversion market, we intend to license our proprietary PPSA™-based product designs to OEMs within our target markets, as well as license our technologies for other markets which we do not plan to enter directly. The basis for this approach is the belief that OEMs may achieve higher product margins and gain more market share by providing PPSA™-based products, which are differentiated from the traditional product offerings in the industry, to their customers. We believe such strategic relationships with key OEM licensees would enable us to reap the benefits of PPSA™ and gain market share more quickly than by strictly manufacturing and distributing our products.
Target Markets
Currently, our primary markets are stand-alone storage, which represented a majority of our sales in the year ended December 31, 2016, and PV + storage.
Stand-Alone Storage Market
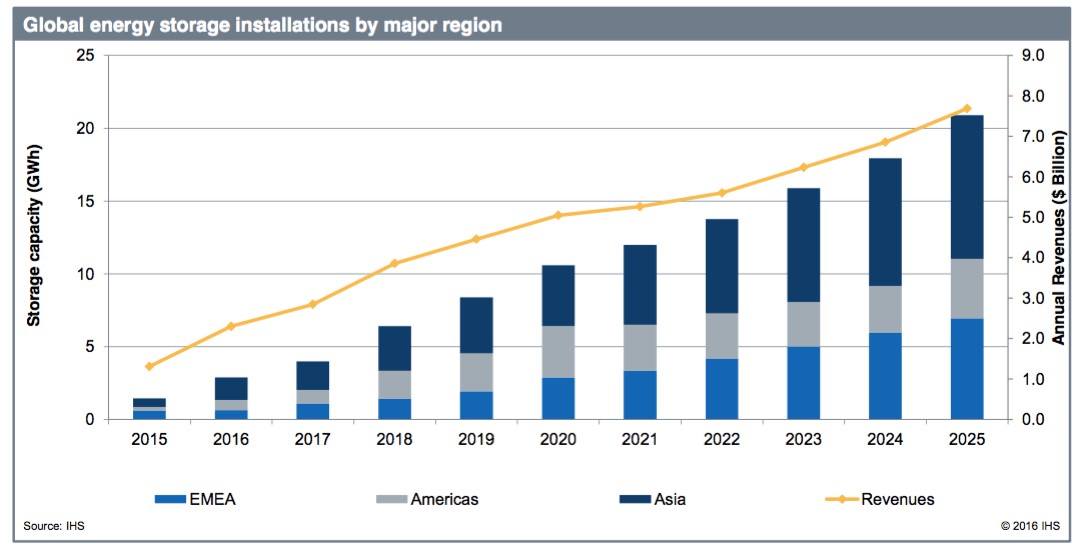
Based on market studies and forecasts by IHS, as shown in Figure 2, the global stand-alone storage market is forecasted to grow to $13 billion cumulatively from 2017 through 2020. Based on our estimate that power conversion systems represent approximately 10% to 15% of the system cost, power conversion systems, such as ours, would account for approximately $2 billion of this market.
Figure 2: Stand-Alone Storage Market Forecast
The stand-alone storage market is served by BESS. BESS are racks of batteries coupled with a system controller and a power conversion system, such as those manufactured by us, to enable electric power to be captured, stored, and used in conjunction with electric power grids. These systems can be large, megawatt-scale systems operated by utilities to better manage their system resources, or smaller kilowatt-scale systems used by businesses and designed to enable these businesses to manage their power use and mitigate utility imposed "peak demand charges", which are charges utilities levy on their business customers for delivery of power at peak usage times of the day, such as mid-afternoons in the summer. The growth of peak demand charges has been substantial over the past decade and now can make up 50% or more of a commercial utility bill in certain markets. This is a trend that is likely to continue as more intermittent resources are added to the utility power grid causing grid instability. Utilities and aggregators of distributed generation resources are also expected to adopt BESS due to the proliferation of renewables and to take advantage of additional value streams such as energy arbitrage, frequency regulation and ancillary services, infrastructure upgrade deferral and locational capacity.
There are strong economic incentives available to commercial and industrial consumers in major US markets such as California and New York in the form of reduced demand charges for installing a BESS and reducing peak consumption. There is also strong regulatory support for such systems. For example, California has issued a mandate for over 1,000 megawatts of new energy storage to be installed by 2020. Our 30kW and 125kW power conversion systems enable these BESS to connect to the utility power grid and, when paired with batteries, offer these customers a substantial cost saving opportunity on their monthly electric bill. This market is still in its early years, but we have established a strong brand and position in this market with our customers having many systems installed and operating today. We believe this market offers a compelling value proposition today for our products.
We believe, as early as the second half of 2017, this market will begin to grow beyond pilot installations to higher volume installations driven by the underlying economics of BESS to commercial and industrial customers. A good indicator of this is the availability of third party financing for BESS. Several of our customers have signed, announced or are in negotiation for financing deals for their BESS products.
We expect the cost of commercial and industrial BESS to continue to decline due primarily to lower battery costs and, as a result, expect significant expansion in the addressable market for these systems. We also believe the combination of lower BESS costs, third-party financing, increases in utility demand charges, and the continued entrance of large, established companies to the BESS space will all contribute to accelerating market growth for stand-alone storage.
PV + Storage Market
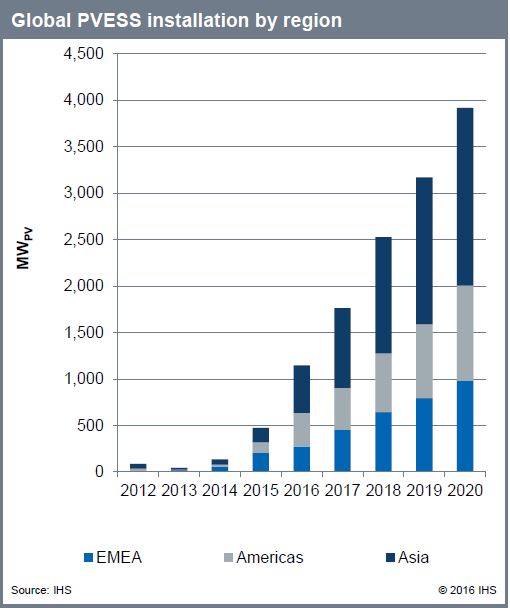
The global solar PV + storage market is forecast by IHS to grow to over 4,000 mega-watts of PV, or MWPV, annually by 2020. Utilizing our estimate of $0.18 per watt, this translates to approximately $2 billion Solar PV + Storage power conversion market over the next four years. See Figure 3 below.
Figure 3: PV + Storage Market Forecast
PV has one of the lowest levelized costs of energy for new electrical generation capacity and this is expected to remain true in the near term. We expect distributed PV to continue to be a high growth business as system costs have fallen dramatically over the past several years. As such, the economics of generating PV for local consumption is expected to remain strong for several more years, especially given the investment tax credit, or ITC, extension passed by Congress and signed into law in 2015 for solar energy production. Our new Sundial™ products were launched in 2016 to directly address this market.
One shortcoming of distributed, behind-the-meter PV systems is that they require connection to the utility power grid in order to operate. For example, a business with PV on its roof will not, in most cases, benefit from the ability to generate power should the utility power grid go down. Another shortcoming of distributed PV systems is the instability they cause on the local power lines. Utility power grids were not designed to manage power inflow from the end of the lines. As such, distributed generation sources can lead to wide swings in line voltages when clouds pass and power output falls off, requiring the utility to ramp up its central power stations to make up for the shortfall in solar. We believe the proliferation of PV, its intermittency and the elimination of net metering in many states will drive significant growth in the PV + storage market.
Our power conversion products help resolve these shortcomings. For example, when a distributed PV system is connected to a BESS that includes one of our Stabiliti™ multi-port PCS, the business will benefit from the ability to form and manage a local microgrid powered by the PV system and BESS even when the utility power grid is down. This capability is attractive to electricity consumers who need to power critical loads even in a blackout. Our Stabiliti™ PCS are also equipped to meet evolving utility requirements for low voltage ride-through and other key operating parameters, enabling the PV and BESS it connects to the grid to help stabilize the utility power grid when voltage or frequency fluctuates due to imbalances in load and supply.
Commercial and industrial BESS are able to generate value far beyond peak demand reduction. We believe our products will become increasingly attractive to co-locate BESS with distributed PV. IHS, which has strong renewable industry focus,
forecasts that global installations of grid-tied commercial BESS coupled with PV will grow to over 1,500 MW of commercial PV + storage systems being installed annually by 2020.
According to their research, IHS believes that systems will be deployed in two principal configurations. The present configuration is to have separate BESS and PV systems tied together through the AC wiring, which is supported by all of our current products. A second, emerging configuration will be to place the BESS and the PV system behind a single PCS with two DC inputs. This configuration is forecast to improve efficiency, reduce costs, and allow PV harvesting when operating without a utility power grid present in microgrid mode. Our Sundial Plus™ was designed specifically to enable this lower cost and more efficient second configuration.
Also according to IHS, the global commercial PV industry is projected to grow to over 33GW annually by 2020. IHS further forecasts that these commercial systems will have a 2% storage attachment rate by 2020, providing for a nearly 700MW annual commercial PV + storage market. These new PV + storage markets include providing backup power during blackouts, improving grid stability in high penetration PV areas and reducing fossil fuel consumption in remote and off-grid microgrids.
Other Markets
Although our technology may be suitable for other vertical markets within the global power conversion market landscape, we do not currently offer products for sale directly to other power conversion markets such as the VFD, uninterruptible power supply, rail, wind or EV traction drive markets.
In addition to the markets discussed above, we also have opportunities for market expansion into fast electric vehicle chargers in certain applications where our products’ compact size and multi-port capabilities can unlock value for the system integrator particularly in locations where battery storage is coupled with the charging system to eliminate demand charges or expand the charging systems response capabilities. We have provided PCS to multiple EV charging system integrators who have deployed initial projects using our products coupled with batteries at EV charging stations to prove out these concepts. As these initial installations begin to operate, the value propositions of these new opportunities will become clearer.
We plan to continue to monitor all power conversion markets for opportunities to create solutions for customers and unlock the broader value of our patented technology.
Intellectual Property
We rely on a combination of patents, laws that protect intellectual property, confidentiality procedures, and contractual restrictions with our employees and others, to establish and protect our intellectual property rights. In addition, the software that is shipped with our products is encrypted. As of December 31, 2016, we have 50 US and 11 foreign issued patents. We also had approximately 100 additional pending U.S. and international patent applications. We expect to continue to build our patent estate for both our core power conversion technology, our bi-directional switch technology and other technological developments that broaden the scope of our technology platform.
Customers
Although we are expanding our customer base and channels to market, we have historically been reliant on a small number of customers. For the year ended December 31, 2016, Sonnen Inc. and Gexpro accounted for 44% of net revenues. For the year ended December 31, 2015, Sharp Corporation, Gexpro, Green Charge Networks, LLC, and Coda Energy LLC, accounted for 66% of net revenues.
Sales and Marketing
We sell our products primarily to systems integrators for installation as part of a larger turn-key system providing end users with a complete solution for managing their energy consumption. Our products are also sold through distribution channel partners. Before a system integrator agrees to specify our products in their systems, the integrator engages in a lengthy and time-consuming process of testing and evaluating our equipment for use, which typically takes from a few months to as long as a year.
For certain geographic markets and applications, we may seek to enter into licensing agreements that would enable licensees to build our products for sale in local markets or we may license product designs to global brands for specific applications. In 2016, we entered into our first licensing agreement for our Sundial™ with Flex Ltd. (Nasdaq: Flex).
NEXTracker Inc., a Flex company, will sell the Sundial™ as part of its newly launched NX Fusion Plus solar plus storage tracker.
Manufacturing and Supply
We use contract manufacturers to manufacture our products to our specifications. We have an agreement with one of our contract manufacturers pursuant to which we provide it with a rolling forecast of our expected demand. Finished products are produced based on upon our forecast, and we have the ability to delay shipments for up to 18 months from the date of the purchase order. The initial three-year term of the agreement expires in October 2017 and renews annually thereafter unless terminated. We intend to finalize an agreement with a second contract manufacturer in the first quarter of 2017. We believe there are many contract manufacturers that are qualified to manufacture our products to our specifications.
Typically, our contract manufacturers are responsible for the sourcing of components and materials. We qualify sources for our components and materials. Our strategy is to have multiple suppliers for all of our components and materials. Currently, we have multiple sources for most of our components. A very limited number of components are single-sourced and the process of identifying and qualifying alternative sources for these components is underway.
Backlog
Our backlog was approximately $5.5 million at December 31, 2016 compared to $5.2 million at December 31, 2015. The Company defines backlog as consisting of accepted orders from customers for which a product delivery schedule has been specified. The purchased orders comprising backlog are not cancelable in most cases and such orders do not typically provide price protection. Nevertheless, deliveries against received purchase orders may be rescheduled within negotiated parameters and our backlog may therefore not be indicative of the level of future sales.
Competition
We will compete against well-established incumbent power conversion technology providers as these competitors enter the commercial and industrial markets. For our target markets, we believe that PPSA™ may provide significant competitive advantages compared to the traditional power conversion solutions sold by well-established power conversion technology providers.
Traditional Power Conversion: Traditional power conversion systems are the conservative choice, as they are proven and have been commercially available longer than any other type of power conversion system. They provide isolation, but are big, heavy, and relatively inefficient. There have been improvements in the efficiency of transformer-based power conversion systems over the years, but we believe further improvements are limited due to the physical characteristics of transformers themselves. Major suppliers in this market include ABB, Eaton and Schneider Electric.
Transformerless PV Inverters: Transformerless PV solar inverters are a special class of power conversion system applicable only to PV arrays. They have become a popular choice in the market for PV applications, as they are lighter and more efficient than transformer based inverters. These transformerless inverters are one-way (DC to AC) inverters, and provide no electrical isolation. PV systems are not required to be electrically isolated in most electrical code jurisdictions. These PV inverters have no applicability to markets that require electrical isolation. Key providers of transformerless PV inverters include companies such as SMA and SolarEdge.
Research and Development Costs
Research and development costs are presented as a line item under operating expenses and are expensed as incurred. Total research and development costs incurred during the years ended December 31, 2016 and 2015 amounted to $5,224,992 and $5,521,390, respectively.
Employees
As of February 28, 2017, we have 30 employees, all of whom are full-time employees. None of these employees are covered by a collective bargaining agreement, and we believe our relationship with our employees is good.
Industry Certifications
Industry certifications are generally required for our products. The main certification requirement is conformance to UL1741, which specifies standards for grid and product safety for grid-connected generation equipment, including the power conversion systems made by us. A National Recognized Testing Laboratory, or NRTL, must certify our products for conformance to UL1741 before our customers may install and use our products in grid-tied applications in the United States. We utilize both Underwriters Laboratories, or UL, and Intertek, or ETL, for our certification requirements.
The European Union, or EU, Japan and other major jurisdictions have different certification test procedures, but generally test for similar safety and performance capabilities. Local certifications are likely to be required to sell our products outside of the United States for many applications. To date, we have not received any international certifications on our products but have deployed products in a few instances in foreign countries as demonstrations, test projects in laboratories or microgrid applications which may be exempt from the certification requirements. We expect to start the certification process in one or more international markets in 2017.
Government Regulation
Government approval is not required for us to sell our products. However, government support for renewable energy, grid storage, electric vehicle charging infrastructure and improved grid resiliency, including incentives and mandates, may impact the size and growth rate of our target markets. Utility regulations and support may also impact these end markets. In the near term, government and utility support for many of these markets is generally required for these markets to grow and therefore changes in policy by governments or utilities may limit the near-term market opportunities for our products.
Available Information
Our Internet address is www.idealpower.com and our investor relations website is located at ir.idealpower.com. We make available free of charge on our investor relations website under the heading “SEC Filings” our Annual Reports on Form 10-K, Quarterly Reports on Form 10-Q, Current Reports on Form 8-K and amendments to those reports as soon as reasonably practicable after such materials are electronically filed with (or furnished to) the SEC. We also make available on our website, our corporate governance documents, including our code of conduct and ethics. Information contained on our website is not incorporated by reference into this Annual Report on Form 10-K. In addition, the public may read and copy materials we file with the SEC at the SEC’s Public Reference Room at 100 F Street, NE, Washington, DC 20549. The public may obtain information on the operation of the Public Reference Room by calling the SEC at 1-800-SEC-0330. In addition, the SEC maintains an Internet site, www.sec.gov, that includes filings of and information about issuers that file electronically with the SEC.
ITEM 1A: RISK FACTORS
We are subject to various risks that may materially harm our business, prospects, financial condition and results of operations. An investment in our common stock is speculative and involves a high degree of risk. In evaluating an investment in shares of our common stock, you should carefully consider the risks described below, together with the other information included in this report.
The risks described below are not the only risks we face. If any of the events described in the following risk factors actually occurs, or if additional risks and uncertainties later materialize, that are not currently known to us or that we currently deem immaterial, then our business, prospects, results of operations and financial condition could be materially adversely affected. In that event, the trading price of our common stock could decline, and you may lose all or part of your investment in our shares. The risks discussed below include forward-looking statements, and our actual results may differ substantially from those discussed in these forward-looking statements.
Risks Related to the Company
We lack an established operating history on which to evaluate our business and determine if we will be able to execute our business plan. We have also incurred losses in prior periods, expect to incur losses in the future and we can give no assurance that our operations will result in profits.
We were formed in Texas on May 17, 2007 and converted to a Delaware corporation on July 15, 2013. We have a limited operating history that makes it difficult to evaluate our business. Historical sales of our products have been in low volume, and we cannot say with certainty when we will begin to achieve profitability, if ever.
Since inception, we have sustained approximately $45 million in net losses and we had a net loss for the year ended December 31, 2016 of approximately $11 million. We expect to have operating losses at least until such time as we have developed a substantial and stable revenue base. We cannot assure you that we can develop a substantial and stable revenue base or achieve or sustain profitability on a quarterly or annual basis in the future.
As sales of our products have generated limited operating revenues, we have been funding operations primarily through the sale of common stock and, prior to our initial public offering, the issuance of convertible debt. If we are unable to execute our business plan, generate sustainable revenue and achieve profitable operations with our existing capital we would need to raise funds through equity or debt offerings and there can be no assurance that we will be able to do so.
Our future success is difficult to predict because we operate in emerging and evolving markets, and the industries in which we compete are subject to volatile and unpredictable cycles.
The stand-alone storage, solar combined with storage, microgrid and related industries are emerging and evolving markets which may make it difficult to evaluate our future prospects and which may lead to period to period variability in our operating results. Our products are based on unique technology which we believe offers significant advantages to our customers, but the markets we serve are in a relatively early stage of development and it is uncertain how rapidly they will develop. It is also uncertain whether our products will achieve high levels of demand and acceptance as these markets grow. If companies in the industries we serve do not perceive or value the benefits of our technologies and products, or if they are unwilling to adopt our products as alternatives to traditional power conversion solutions, the market for our products may not develop or may develop more slowly than we expect, which could significantly and adversely impact our operating results.
We may also be subject to business cycles. The timing, length, and volatility of these business cycles may be difficult to predict. These markets may be cyclical because of sudden changes in customers’ manufacturing capacity requirements and spending, which depend in part on capacity utilization, demand for customers’ products, the availability and amount of government incentive programs, inventory levels relative to demand, and access to affordable capital. These changes may affect the timing and amounts of customers’ purchases and investments in technology, and materially affect our orders, net sales, operating expenses, and net income. For example, during 2016, we experienced a significant decline in revenues compared to 2015 as a result of delays in awards under California’s Self-Generation Incentive Program, or SGIP, which provides economic incentives for energy storage projects. The California Public Utility Commission, or CPUC, delayed announcing the 2016 awards as it examined and ultimately revised the award solicitation process and other aspects of the SGIP. The revised SGIP was not finalized until July 1, 2016, which delayed the determination of project winners and the processing of the related awards. These delays caused a temporary disruption in the market that impacted 2016 and likely, at least, part of 2017 as awarded projects may not be commissioned and installed until many months after the award is granted. If delays occur in the future under the SGIP or other governmental incentives, our revenues may be reduced.
To meet rapidly changing demand in each of the markets we serve, we must effectively manage our resources and production capacity. During periods of decreasing demand for our products, we must be able to appropriately align our cost structure with prevailing market conditions, effectively manage our supply chain, and motivate and retain key employees. During periods of increasing demand, we must have sufficient manufacturing capacity and inventory to fulfill customer orders, effectively manage our supply chain, and attract, retain, and motivate a sufficient number of qualified individuals. If we are not able to timely and appropriately adapt to changes in our business environment or to accurately assess where we are positioned within a business cycle, our business, financial condition, or results of operations may be materially and adversely affected.
Obsolete inventory as a result of changes in demand for our products, changes in life cycle of our products or regulatory changes could adversely affect our business, operating results and financial condition.
The life cycles of our products depend upon the rapidly evolving industries for which our products are designed. Products with short life cycles require us to closely manage our production and inventory levels. Inventory may also become obsolete because of adverse changes in market demand. We may in the future be adversely affected by obsolete or excess inventories, which may result from unanticipated changes in the estimated total demand for our products or shorter than anticipated product life cycles due to changes in product designs necessitated by market factors or changes to regulatory standards and/or requirements. In addition, certain customers in early markets may change their strategy, exit our target markets and/or go out of business; therefore, some of our product inventory may become obsolete and, thus, adversely affect our business, operating results and financial condition. As an example, in 2016, we recorded a charge of $334,889 for excess and obsolete inventory in connection with the end-of-life, or EOL, of our IBC-30 battery converter. In 2017, we intend to EOL our second generation 30kW and first generation 125kW products. Challenges in managing EOL situations or lower than expected sales prior to the EOL of our products could result in material charges related to excess and obsolete inventory and our business, financial condition, or results of operations may be materially and adversely affected.
To date we have had a limited number of customers. We cannot assure you that our customer base will increase.
We had revenue from two customers that accounted for 44% of net revenue for the year ended December 31, 2016. The Company had an accounts receivable balance from two customers that accounted for 78% of trade receivables at December 31, 2016. As we sell our products to a limited number of customers, we cannot assure you that our customer base will expand or that any decline in net revenue attributable to customer losses will be replaced in a timely manner.
Product development is an inherently uncertain process, and we may encounter unanticipated development challenges and may not be able to meet our product development and commercialization milestones.
Product development and testing may be subject to unanticipated and significant delays, expenses and technical or other problems. We cannot guarantee that we will successfully achieve our milestones within our planned timeframe or ever. We commonly develop prototypes of planned products prior to the full commercialization of these products. We cannot predict whether prototypes of future products will achieve results consistent with our expectations. A prototype could cost significantly more than expected or the prototype design and construction process could uncover problems that are not consistent with our expectations. Prototypes of emerging products are a material part of our business plan, and if they are not proven to be successful, our business and prospects could be harmed.
More generally, the commercialization of our products may also be adversely affected by many factors not within our control, including:
| |
• | the willingness of market participants to try new products and the perceptions of these market participants of the safety, reliability, functionality and cost effectiveness of our products; |
| |
• | policy changes and the availability of governmental incentives at both the state and federal level for our target markets; |
| |
• | the emergence of newer, possibly more effective technologies; |
| |
• | the future cost and availability of the raw materials and components needed to manufacture and use our products; and |
| |
• | the adoption of new regulatory or industry standards that may adversely affect the use or cost of our products. |
Accordingly, we cannot predict that our products will be accepted on a scale sufficient to support development of mass markets for them.
We must achieve design wins to retain our existing customers and to obtain new customers, although design wins achieved do not necessarily result in substantial sales.
Our products are typically integrated into systems by our customers. We must work with these manufacturers early in their design cycles to modify our equipment or design new equipment to meet the requirements of their systems. Manufacturers typically choose one or two vendors to provide the components for use in their systems. Selection as one of these vendors is called a design win. It is critical that we achieve these design wins in order to retain existing customers and to obtain new customers.
We believe that equipment manufacturers often select their suppliers based on factors including long-term relationships and end user demand. Accordingly, we may have difficulty achieving design wins from equipment manufacturers who are not currently our customers. In addition, we must compete for design wins for new systems and products of our existing customers, including those with whom we have had long-term relationships. Our efforts to achieve design wins are time consuming and expensive and may not be successful. If we are not successful in achieving design wins, or if we do achieve design wins but our customers’ systems that utilize our products are not successful, our business, financial condition, and results of operations could be materially and adversely impacted.
Once a manufacturer chooses a component for use in a particular system, it is likely to retain that component for the life of that system. Our sales and growth could experience material and prolonged adverse effects if we fail to achieve design wins. However, design wins do not always result in substantial sales, as sales of our products are dependent upon our customers’ sales of their products.
We will be subject to applicable third-party certification to ensure compliance with applicable codes and standards of the countries in which we sell products, which are costly and may prevent or delay us from marketing our products in those countries.
In addition to third-party certification to ensure compliance with applicable codes and standards in the United States, we are subject to the third-party certification of our products to ensure compliance with applicable codes and standards for each foreign country to which we export our products. For example, in the EU, third-party certification requires compliance with Conformité Européene, or CE, standards and is evidenced by a CE mark. The CE mark is the manufacturer’s declaration that the product complies with the essential requirements of the relevant European health, safety and environmental protection legislation. Additionally, to sell a product in any specific country in the EU, the product must meet the International Electrotechnical Commission, or IEC, codes specified for products in the specific country. The applicable codes vary from country to country. It generally takes several months to obtain the relevant CE and IEC certifications. Any changes in codes and standards and related third-party compliance testing and listing may cause us to incur additional costs. We may not be able to obtain US or foreign third-party certification on a timely basis, if at all, and any failure to do so may cause us to incur additional costs or prevent us from marketing or selling our products in US or foreign countries, which may have a material adverse effect on our business, financial condition and results of operations.
We have received grant funds from the United States for the development of a bi-directional switch. In certain instances, the United States may obtain title to inventions related to this effort. If we were to lose title to those inventions, we may have to pay to license them from the United States in order to manufacture the inventions. If we were unable to license those inventions from the United States, it could slow down our product development.
In conjunction with the Advanced Research Projects Agency-Energy, or ARPA-E, grant we received from the Department of Energy, we granted to the United States a non-exclusive, nontransferable, irrevocable, paid-up license to practice or have practiced for or on behalf of the United States inventions related to the bi-directional switch and made within the scope of the grant. If we fail to disclose to the Department of Energy an invention made with grant funds that we disclose to patent counsel or for publication, or if we elect not to retain title to the invention, the United States may request that title to the subject invention be transferred to it.
We also granted “march-in-rights” to the United States in connection with any bi-directional switch inventions in which we choose not to retain title, if those inventions are made under the ARPA-E grant. Pursuant to the march-in-rights, the United States has the right to require us, any person to whom we have assigned our rights, or any exclusive licensee to grant a non-exclusive, partially exclusive, or exclusive license in any field of use to a responsible applicant upon terms that are reasonable. If the license is not granted as requested, the United States has the right to grant the license if it determines that we have not achieved practical application of the invention in the field of use, the action is necessary to alleviate health or safety needs, the action is necessary to meet requirements for public use specified by Federal regulations and such requirements have not been
satisfied, or the action is necessary because an agreement to manufacture the invention in the United States has not been obtained or waived or because any such agreement has been breached.
If we lost title to the United States as a result of any of these events, we would have to pay to license the inventions, if needed, to manufacture the bi-directional switch from the United States. If we were unable to license those inventions from the United States, it could slow down our product development.
As we continue to grow and to develop our intellectual property, we could attract threats from patent monetization firms or competitors alleging infringement. We may incur substantial costs as a result of litigation or other proceedings relating to patent and other intellectual property rights.
As we continue to grow and to develop our intellectual property, we could attract threats from patent monetization firms or competitors alleging infringement of intellectual property rights.
In addition, some of our competitors may be able to sustain the costs of complex patent litigation more effectively than we can because they have substantially greater resources. If we do not prevail in this type of litigation, we may be required to: pay monetary damages; stop commercial activities relating to our product; obtain one or more licenses in order to secure the rights to continue manufacturing or marketing certain products; or attempt to compete in the market with substantially similar products. Uncertainties resulting from the initiation and continuation of any litigation could limit our ability to continue some of our operations.
We expect to license our technology in the future; however the terms of these agreements may not prove to be advantageous to us. If the license agreements we enter into do not prove to be advantageous to us, our business and results of operations will be adversely affected.
During 2016, we entered into our first licensing agreement and we expect to license the manufacture of our product designs for certain markets as well as license our technology for certain potential applications which we choose not to pursue directly through the sale of products in the future. However, we may not be able to secure license agreements with customers on terms that are advantageous to us. Furthermore, the timing and volume of revenue earned from license agreements is and will be outside of our control. If the license agreements we have, or enter into in the future, do not prove to be advantageous to us, our business and results of operations will be adversely affected.
Until recently, we have not devoted significant resources towards the marketing and sale of our products and we continue to rely on the marketing and sales efforts of third parties whom we do not control.
We expect that the marketing and sale of our products to end user customers will continue to be conducted primarily by a combination of system integrators, third-party strategic partners, distributors, and original equipment manufacturers, or OEMs. Consequently, commercial success of our products will depend, to a great extent, on the efforts of others. We may not be able to identify, maintain or establish additional and/or appropriate relationships in the future. We can give no assurance that these third parties will focus adequate resources on selling our products or will be successful in selling them. In addition, these third-parties have or may require us to provide volume price discounts and other allowances, customize our products or provide other concessions that could reduce the potential profitability of these relationships. Failure to develop sufficient customer, distribution and marketing relationships in our target markets will adversely affect our commercialization schedule and to the extent we have entered or enter into such relationships, the failure of our distributors and other third parties to assist us with the marketing and distribution of our products, or to meet their monetary obligations to us, may adversely affect our financial condition and results of operations.
A material part of our success depends on our ability to manage our suppliers and contract manufacturers. Our failure to manage our suppliers and contract manufacturers could materially and adversely affect our results of operations and relations with our customers.
We rely upon suppliers to provide the components necessary to build our products and on contract manufacturers to procure components and assemble our products. There can be no assurance that key suppliers and contract manufacturers will provide components or products in a timely and cost efficient manner, provide quality components or manufacturing and assembly services or otherwise meet our needs and expectations. Our ability to manage such relationships and timely replace suppliers and contract manufacturers, if necessary, is critical to our success. Our failure to timely replace our contract manufacturers and suppliers, should that become necessary, could materially and adversely affect our results of operations and relations with our customers.
We may need additional financing to execute our business plan and fund operations, which additional financing may not be available on commercially reasonable terms or not at all.
We believe that our current cash and working capital resources, together with the estimated net proceeds of approximately $13.6 million from our March 2017 private placement, will be sufficient to fund our operations for at least the next twelve months. If we are unable to generate sufficient cash flow from our operations to fund our future working capital needs, we will be required to obtain additional financing to continue our operations and execute our business plan. We may not be able to obtain such financing on commercially reasonable terms or at all. If we are unable to obtain such financing when needed, our business could fail.
The macro-economic environment in the United States and abroad has adversely affected, and may in the future adversely affect, our ability to raise capital, which may potentially impact our ability to continue our operations.
As a company with limited revenues to date, we have relied on raising funds from investors to support our future research and development activities and our operations. Macro-economic conditions in the United States and abroad may result in a tightening of the credit markets and/or less capital available for small public companies, which may make it more difficult to raise capital. If we are unable to raise funds as and when we need them, we may be forced to curtail our operations or even cease operating altogether.
We are subject to credit risks.
Some of our customers may experience financial difficulties and/or may fail to meet their financial obligations to us. As a result, we may incur charges for bad debt provisions related to some trade receivables. In addition, in connection with the growth of the renewable energy market and other markets for our products, we are gaining new customers, some of which have relatively short histories of operations, are located outside the United States or are newly formed companies. As a result, it is difficult to ascertain financial information in order to appropriately extend credit to these customers. Further, the volatility in the renewable energy market may put additional pressure on our customers’ financial positions, as they may be required to respond to large swings in revenue. The renewable energy industry has also, from time to time, seen an increasing amount of bankruptcies and reorganizations as the availability of financing has diminished. In 2016, one of our customers, SunEdison Inc., filed for bankruptcy.
If customers fail to meet their financial obligations to us, or if the assumptions underlying our recorded bad debt provisions with respect to receivables obligations do not accurately reflect our customers’ financial condition and payment levels, we could incur write-offs of receivables in excess of our provisions, which could have a material adverse effect on our cash flow and operating results.
If our products have component malfunctions or design defects, we may be exposed to lawsuits and/or other claims and we may not be able to control our warranty exposure, which could increase our expenses, harm our reputation and prevent us from growing our business.
We currently offer, and expect to continue to offer, a warranty with respect to our products and a design warranty with respect to licensing agreements. Due to our limited long-term history of operating data, our warranty reserve is estimated based on engineering judgment and third party assessments of our product reliability. If our products have component malfunctions or design defects, the accumulated cost of warranty claims could be significant. If the cost of warranty claims exceeds any reserves we may establish for such claims, our results of operations and financial condition could be adversely affected. In 2016, we recorded incremental charges of $116,448 to increase our reserves for warranty claims and may have other potentially material incremental charges in the future.
In addition, potential customers may rely on our products for critical needs and a malfunction of our products could result in warranty claims or other product liability. A well-publicized actual or perceived problem could adversely affect the market’s perception of our products. This could result in a decline in demand for our products, which would reduce revenue and harm our business. Further, since our products are used in systems that are made by other manufacturers, we may be subject to product liability claims or negative market perception of our products even if our products do not malfunction.
We are highly dependent on the services of R. Daniel Brdar and William Alexander, as well as other key members of our executive management team. Our inability to retain these individuals could impede our business plan and growth strategies, which could have a negative impact on our business and the value of your investment.
Our ability to implement our business plan depends, to a critical extent, on the continued efforts and services of R. Daniel Brdar, our Chief Executive Officer and President, William Alexander, our founder and Chief Technology Officer, and other members of our executive management team. If we lose the services of any of these persons during this important time in our development, the loss may result in a delay in the implementation of our business plan and plan of operations. We can give no assurance that we could find satisfactory replacements for these individuals on terms that would not be unduly expensive or burdensome to us. We do not currently carry a key-man life insurance policy that would assist us in recouping our costs in the event of the death or disability of any of these persons.
Any failure by management to properly manage our expected rapid growth could have a material adverse effect on our business, operating results and financial condition.
If our business develops as expected, we anticipate that we will grow rapidly in the near future. Our failure to manage properly our expected rapid growth could have a material adverse effect on our ability to retain key personnel. Our expansion could also place significant demands on our management, operations, systems, accounting, internal controls and financial resources. If we experience difficulties in any of these areas, we may not be able to expand our business successfully or effectively manage our growth. Any failure by management to manage growth and to respond to changes in our business could have a material adverse effect on our business, financial condition and results of operations.
Backlog may not result in revenue.
Our backlog was approximately $5.5 million at December 31, 2016. We define backlog as consisting of accepted orders from customers for which an expected product delivery schedule has been specified. The purchase orders comprising backlog are not cancelable in most cases and such orders generally do not provide price protection. Nevertheless, deliveries against received purchase orders may be rescheduled within negotiated parameters or canceled in certain limited instances and our backlog may, therefore, not be indicative of revenues in any given period. Our backlog is highly concentrated with a limited number of customers. If any of these customers change their strategy, exit our target markets and/or go out of business, our backlog would be materially adversely impacted.
Risks Relating to the Industry
The electric power conversion industry is competitive, has a number of well-financed incumbents and may see a significant number of new market entrants. We cannot guarantee that we can compete successfully.
We may compete against providers of PCS that are well established and have substantially greater assets, including manufacturing, marketing, and financial assets. These incumbents also have strong market share and name brand recognition in the industry. Potential competitors include ABB, Ltd., Eaton Corporation plc, Huawei Technologies Co., Ltd., SMA Solar Technology AG, and Schneider Electric SE. Pricing and servicing, as well as the general quality, efficiency and reliability of products, are significant competitive criteria in this industry. New market entrants may offer competitive new technologies and products, and will contribute to significant price competition.
Our ability to successfully compete on each of these criteria is material to the acceptance of our products and their future profitability. In addition, the industry may resist new technology and products from suppliers that are not well capitalized with long track records of performance. Our competitors use their balance sheet and brand recognition to their competitive advantage. Should our products become commercially successful, competitors may seek to drive their own innovation and adopt or copy ideas, designs and features to regain their competitive positions. Incumbent or new competitors may develop or offer technologies and products that may be more effective or popular than our products and these competitors may be more successful in marketing their products than we are in marketing our products.
Our ability to achieve our cost reduction goals now and in the future and maintain pricing at or near the level of our competitors is critical to our long-term success and the viability of our business as, over the long-term, price is likely the key competitive criteria in the power electronics industry. Additionally, price competition may result in lower than expected margins for our products which would adversely affect our business prospects, financial condition and operating results.
We expect to compete on the basis of our products’ technological innovation, flexibility, features and smaller footprint at a market competitive price. Unrelated technological advances in alternative energy products or other power conversion
technologies may negatively impact the development of our products or make our products uncompetitive or obsolete at any time. We cannot guarantee that we will be able to compete successfully in the electric power conversion industry.
Our business is and we expect will continue to be substantially dependent on utility rate structures and government incentive programs that encourage the use of alternative energy sources. The reduction or elimination of government subsidies and economic incentives for energy-related technologies would harm our business.
The current market for, and we believe that near-term growth of energy-related technologies, including power conversion technology, relies and will continue to rely on the availability and size of government and economic incentives and grants (including, but not limited to, the U.S. ITC and various state and local incentive programs). These incentive programs could be challenged by utility companies, or for other reasons found to be unconstitutional, and/or could be reduced or discontinued for other reasons. The reduction, elimination, or expiration of government subsidies and economic incentives would harm our business.
A combination of utility rate structures and government subsidies that encourage the use of alternative energy sources is a primary driver of demand for our products. For example, public utilities are often allowed to collect demand charges on commercial and industrial customers in addition to traditional usage charges. In addition, the federal government and many states encourage the use of alternative energy sources through a combination of direct subsidies and tariff incentives such as net metering for users that use alternative energy sources such as solar power. California also encourages alternative energy technology through its SGIP which offers rebates for businesses and consumers who adopt certain new technologies. As a result of these incentives, we believe that a substantial portion of the products we have sold have been for use by end customers in California. Other states have similar incentives and mandates which encourage the adoption of alternative energy sources. Notwithstanding the adoption of other incentive programs, we expect that California will be the most significant market for the sale of our products in the near term for stand-alone storage applications. Should California or another state in which we derive a substantial portion of our product revenues in the future change its utility rate structure or delay, eliminate or significantly reduce its incentive programs, demand for our products could be substantially affected, which would adversely affect our business prospects, financial condition and operating results.
For example, in 2016, we experienced a material decline in revenues compared to 2015 as a result of delays in awards under California’s SGIP, which provides economic incentives for energy storage projects. Awards under the SGIP were delayed as the California Public Utility Commission, or CPUC, examined and ultimately revised the award solicitation process and other aspects of the SGIP. The revised SGIP was not finalized until July 2016, which delayed the determination of project winners and the processing of the related awards. Political changes, disruptions or gridlock, or reviews or revisions of previously announced incentive programs or procedures for making awards or administering such programs could have a material adverse impact on our financial results and future prospects.
Changes to the National Electrical Codes could adversely affect our technology and products.
Our products are installed by system integrators that must meet the National Electrical Codes, or NEC, standards, including using equipment that meets industry standards such as UL1741. The NEC standards address the safety of these systems. The NEC standards, along with the UL1741 and IEEE1547 requirements, continue to evolve and are subject to change. If we respond to these changing standards and requirements more slowly than our competitors, or if we are unable to meet new standards and requirements, our products will be less competitive.
Some of the components of energy storage products pose potential safety risks which could create negative public perception regarding the energy storage markets.
Many energy storage products make use of lithium-ion batteries, which have been observed in certain applications, such as automotive applications, to catch fire or vent smoke and flame. Such events have raised concerns, and future events may lead to additional concerns, about the safety of lithium-ion batteries. Negative public perceptions regarding the suitability of lithium-ion batteries for energy storage applications or any future incident involving lithium-ion batteries, even if such incident does not involve our power conversion systems or relates to an application other than energy storage, could negatively impact the continued adoption of energy storage products and have a material adverse impact on our sales and our business.
Growth in our target markets largely depends on the continued decline in battery prices
Our initial target markets of stand-alone storage and PV + storage are all early stage markets. Growth in these markets is highly dependent on a continued decline in battery prices as batteries represent the largest component of system cost. Any disruption in the supply of batteries resulting in higher than expected battery pricing or stagnation in the level of price declines
for batteries could result in slower than expected growth in our target markets and, as a result, could have a material adverse effect on our sales and our business.
New technologies in the alternative energy industry may supplant our current products and technology in this market, which would harm our business and operations.
The alternative energy industry is subject to rapid technological change. Our future success will depend on the cutting edge relevance of our technology, and thereafter on our ability to appropriately respond to changing technologies and changes in function of products and quality. If new technologies supplant our power conversion technology, our business would be adversely affected and we will have to revise our plan of operation.
Businesses, consumers, and utilities might not adopt alternative energy solutions as a means for providing or obtaining their electricity and power needs.
On-site distributed power generation solutions that utilize our products provide an alternative means for obtaining electricity and are relatively new methods of obtaining electrical power. There is a risk that businesses, consumers, and utilities may not adopt these new methods at levels sufficient to grow our business. Traditional electricity distribution is based on the regulated industry model whereby businesses and consumers obtain their electricity from a government regulated utility. For alternative methods of distributed power to succeed, businesses, consumers and utilities must adopt new purchasing practices and must be willing to rely upon less traditional means of providing and purchasing electricity. As larger solar projects come online, utilities are becoming increasingly concerned with grid stability, power management and the predictable loading of such power onto the grid.
We cannot be certain that businesses, consumers, and utilities will choose to utilize on-site distributed power at levels sufficient to sustain our business. The development of a mass market for our products may be impacted by many factors which are out of our control, including:
| |
• | market acceptance of systems that incorporate our products; |
| |
• | the cost competitiveness of these systems; |
| |
• | regulatory requirements and government incentives; and |
| |
• | the emergence of newer, more competitive technologies and products. |
If a mass market fails to develop or develops more slowly than we anticipate, we may be unable to recover the costs we will have incurred to develop these products.
Our sales cycle is lengthy and variable, which makes it difficult for us to accurately forecast revenue and which may affect our quarterly results.
The sales cycle for our products is typically lengthy and unpredictable, which makes it difficult for us to accurately forecast revenues in a given period, and may cause revenue and operating results to vary significantly from period to period. We currently sell our products primarily to system integrators that integrate our products into larger “turn-key” solutions for their customers. Before system integrators agree to specify our products in their systems, the integrators engage in a lengthy and time-consuming process of testing and evaluating our equipment. This process can take from a few months to as long as a year. Even if our products are approved for use by a system integrator, the system integrator may not place an order for our equipment until the system integrator has entered into a contract with the end user for the design and installation of the system. In many cases, the system integrator is required to respond to a detailed request for proposal or to submit a proposal before a contract for the system is executed. As a result, there may be a significant period of time between the time our products are approved for use by a particular system integrator and the time we record revenue from the sale of our products. As a result of potentially lengthy sales cycles, we may have difficulty in accurately predicting our operating results for any given period, and may experience significant unanticipated fluctuations in our revenues from period to period. Any failure to achieve anticipated revenues for a period could adversely affect our operating results and the market price of our common stock.
Our revenue and operating results for any quarterly reporting period may fluctuate significantly depending on the timing of the delivery of our products.
Our revenue from product sales has resulted from the sale of a relatively low volume of units to a limited number of customers. As a result, a change in the expected delivery date for a particular customer order could have a significant impact on our quarterly revenues and operating results. Although we maintain a small finished goods inventory, in most cases products
are produced for us by our contract manufacturer in response to a particular customer order. Because of our varying sales cycles, our manufacturing lead times and the limited to moderate flexibility in rescheduling delivery dates we provide to our customers, we may not be able to accurately predict the timing of the delivery of a particular order. Significant unanticipated fluctuations in our revenues from period to period could adversely affect our operating results and the market price for our common stock.
Risks Related to Owning Our Common Stock
The public market for our common stock may be volatile. This may affect the ability of our investors to sell their shares as well as the price at which they sell their shares.
The market price for the shares may be significantly affected by factors such as variations in the volume of trading activity, quarterly and yearly operating results, general trends in the alternative energy industry or other markets we serve, and changes in state or federal regulations affecting us and our industry. Furthermore, in recent years the stock market has experienced extreme price and volume fluctuations that are unrelated or disproportionate to the operating performance of the affected companies. Such broad market fluctuations may adversely affect the market price of our common stock.
We have the right to issue shares of preferred stock. If we were to issue preferred stock, it is likely to have rights, preferences and privileges that may adversely affect the common stock.
We are authorized to issue 10,000,000 shares of “blank check” preferred stock, with such rights, preferences and privileges as may be determined from time-to-time by our board of directors. Our board of directors is empowered, without stockholder approval, to issue preferred stock in one or more series, and to fix for any series the dividend rights, dissolution or liquidation preferences, redemption prices, conversion rights, voting rights, and other rights, preferences and privileges for the preferred stock. The issuance of shares of preferred stock, depending on the rights, preferences and privileges attributable to the preferred stock, could reduce the voting rights and powers of the common stock and the portion of our assets allocated for distribution to common stockholders in a liquidation event, and could also result in dilution in the book value per share of the common stock we are offering. The preferred stock could also be utilized, under certain circumstances, as a method for raising additional capital or discouraging, delaying or preventing a change in control of the Company, to the detriment of the investors in the common stock offered hereby. We cannot assure you that we will not, under certain circumstances, issue shares of our preferred stock. In March 2017, we issued 708,430 non-voting shares of preferred stock to certain investors pursuant to a private placement of common stock, preferred stock and warrants to purchase common stock.
We have not paid dividends in the past and have no immediate plans to pay dividends.
We plan to reinvest all of our earnings, to the extent we have earnings, in order to market our products and to cover operating costs and to otherwise become and remain competitive. We do not plan to pay any cash dividends with respect to our securities in the foreseeable future. We cannot assure you that we would, at any time, generate sufficient surplus cash that would be available for distribution to the holders of our common stock as a dividend. Therefore, you should not expect to receive cash dividends on our common stock.
We incur significant costs as a result of being a public company that reports to the Securities and Exchange Commission and our management is required to devote substantial time to meet compliance obligations.
As a public company reporting to the Securities and Exchange Commission, we incur significant legal, accounting and other expenses. We are subject to reporting requirements of the Exchange Act and the Sarbanes-Oxley Act, as well as rules subsequently implemented by the Securities and Exchange Commission that impose significant requirements on public companies, including requiring establishment and maintenance of effective disclosure and financial controls and changes in corporate governance practices. Our management and other personnel are required to devote a substantial amount of time to these and other new compliance initiatives. In addition, we believe these rules and regulations may make it more costly for us to obtain director and officer liability insurance, and we may be required to accept reduced policy limits and coverage or incur substantially higher costs to obtain the same or similar coverage in the future. As a result, it may be more difficult for us to attract and retain qualified people to serve on our board of directors, on our board committees or as executive officers.
Shares eligible for future sale may adversely affect the market for our common stock.
Sales of substantial amounts of our common stock in the public market, or the perception that these sales could occur, could cause the market price of our common stock to decline. These sales could also make it more difficult for us to sell equity or equity-related securities in the future at a time and price that we deem appropriate.
At December 31, 2016, we had 9,559,213 shares of common stock outstanding. Shares beneficially owned by our affiliates and employees are subject to volume and other restrictions under Rules 144 and 701 under the Securities Act of 1933, as amended, or the Securities Act, various vesting agreements, our insider trading policy and/or any applicable 10b5-1 trading plan. Shares that are not beneficially owned by our affiliates and employees generally can be freely sold in the public market, subject in some cases to restrictions under Rule 144.
At December 31, 2016, we had 3,006,357 potentially dilutive shares outstanding and we may grant additional options, stock-based awards and/or warrants in the future. If our stock price rises, the holders of vested options, stock-based awards or warrants may exercise their options, stock-based awards and/or warrants and sell a large number of shares. Any sale of a substantial number of shares of our common stock may have a material adverse effect on the market price of our common stock.
Our charter documents and Delaware law may inhibit a takeover that stockholders consider favorable.
Our Certificate of Incorporation, or Certificate, and bylaws and applicable provisions of Delaware law may delay or discourage transactions involving an actual or potential change in control or change in our management, including transactions in which stockholders might otherwise receive a premium for their shares, or transactions that our stockholders might otherwise deem to be in their best interests. The provisions in our Certificate and bylaws:
| |
• | authorize our board of directors to issue preferred stock without stockholder approval and to designate the rights, preferences and privileges of each class; if issued, such preferred stock would increase the number of outstanding shares of our capital stock and could include terms that may deter an acquisition of us; |
| |
• | limit who may call stockholder meetings; |
| |
• | do not permit stockholders to act by written consent; |
| |
• | do not provide for cumulative voting rights; and |
| |
• | provide that all vacancies may be filled by the affirmative vote of a majority of directors then in office, even if less than a quorum. |
In addition, Section 203 of the Delaware General Corporation Law may limit our ability to engage in any business combination with a person who beneficially owns 15% or more of our outstanding voting stock unless certain conditions are satisfied. This restriction lasts for a period of three years following the share acquisition. These provisions may have the effect of entrenching our management team and may deprive you of the opportunity to sell your shares to potential acquirers at a premium over prevailing prices. This potential inability to obtain a control premium could reduce the price of our common stock. See “Anti-Takeover Effects of Certain Provisions of Delaware Law and Our Charter Documents” for additional information.
If securities or industry analysts do not publish or do not continue to publish research or reports about our business, or if they issue an adverse or misleading opinion regarding our stock, our stock price and trading volume could decline.
The trading market for our common stock is influenced by the research and reports that industry or securities analysts publish about us or our business. Presently, a number of securities analysts publish reports on us on a regular basis. If any of the analysts who cover us now or in the future issue an adverse opinion regarding our stock, our stock price would likely decline. If one or more of these analysts ceases coverage of our company or fail to publish reports on us regularly, we could lose visibility in the financial markets, which in turn could cause our stock price or trading volume to decline.
ITEM 1B: UNRESOLVED STAFF COMMENTS
None.
ITEM 2: PROPERTIES
Our principal office is located at 4120 Freidrich Lane, Suite 100, Austin, Texas 78744. We lease 14,782 square feet of office and laboratory space under a triple net lease. The lease commenced on June 1, 2014 and has a term of 48 months.
ITEM 3: LEGAL PROCEEDINGS
We are not a party to any pending legal proceedings.
ITEM 4: MINE SAFETY DISCLOSURES
Not applicable.
PART II
ITEM 5: MARKET FOR REGISTRANT'S COMMON EQUITY, RELATED STOCKHOLDER MATTERS AND ISSUER PURCHASES OF EQUITY SECURITIES
Our common stock is quoted under the symbol IPWR on the NASDAQ Capital Market. The table below presents the range of high and low sales prices of our common stock for the years ended December 31, 2016 and 2015.
|
| | | | | | | |
High and low sales prices |
| High | | Low |
Fiscal year ended December 31, 2016 | |
| | |
|
First quarter | $ | 8.13 |
| | $ | 3.90 |
|
Second quarter | $ | 6.63 |
| | $ | 3.73 |
|
Third quarter | $ | 5.60 |
| | $ | 4.48 |
|
Fourth quarter | $ | 5.60 |
| | $ | 2.97 |
|
Fiscal year ended December 31, 2015 | |
| | |
|
First quarter | $ | 10.21 |
| | $ | 5.93 |
|
Second quarter | $ | 11.53 |
| | $ | 7.75 |
|
Third quarter | $ | 8.55 |
| | $ | 6.10 |
|
Fourth quarter | $ | 9.65 |
| | $ | 6.45 |
|
As of March 20, 2017 we had approximately 220 shareholders of record. The name, address and telephone number of our stock transfer agent is Corporate Stock Transfer, Inc., 3200 Cherry Creek South Drive, Suite 430, Denver, Colorado 80209, (303) 282-4800.
Dividends
We have not paid any cash dividends on our common stock since our inception and do not anticipate paying any cash dividends in the foreseeable future. We plan to retain our earnings, if any, to provide funds for the expansion of our business.
Securities Authorized for Issuance under Equity Compensation Plans
The table below provides information, as of December 31, 2016, regarding our 2013 Equity Incentive Plan, or the Plan, under which our equity securities are authorized for issuance to officers, directors, employees, consultants, independent contractors and advisors.
|
| | | | | | | | | | | | | | |
Plan category | | Number of securities to be issued upon exercise of outstanding options, warrants and rights (a) | | | | Weighted-average exercise price of outstanding options, warrants and rights (b) | | Number of securities remaining available for future issuance under equity compensation plans (excluding securities reflected in column (a)) (c) | | |
Equity compensation plans approved by security holders | | 1,277,566 |
| | (1) | | $ | 7.16 |
| | 655,127 |
| | (2) |
| |
(1) | This amount includes performance stock units, or PSUs, granted to employees. |
| |
(2) | This amount will not be subject to future increases, absent shareholder approval of an increase in the securities authorized for issuance under the Plan. |
Recent Issuances of Unregistered Securities
On February 1, 2016, we issued 3,596 shares of common stock to a warrant holder in connection with the exercise of a warrant. The per share exercise price was $3.47626, for a total of $12,501. The Company relied on the exemption provided by Section 4(a)(2) of the Securities Act of 1933 to issue the common stock inasmuch as the warrant holder was an accredited investor and there was no form of general solicitation or general advertising relating to the offer.
On October 26, 2016, we issued 2,149 shares of common stock to a warrant holder in connection with the exercise of a warrant. The per share exercise price was $3.47626 and the warrant was exercised on a cashless basis. The Company relied on the exemption provided by Section 3(a)(9) of the Securities Act of 1933 to issue the common stock.
Use of Proceeds
In 2015, we closed an underwritten follow-on offering of 2,225,825 shares, inclusive of the underwriter’s overallotment of 290,325 shares, of our common stock at a price of $7.75, before underwriting discounts and commissions. The offer and sale of all shares in the follow-on offering were registered under the Securities Act of 1933, as amended pursuant to a registration statement on Form S-3 (registration number 333-200661), and raised approximately $15.9 million in net cash proceeds after expenses.
In March 2017, we completed a private placement for an aggregate 5,220,826 shares of common stock and 708,430 shares of preferred stock together with warrants to purchase 5,929,256 shares of common stock at a price of $2.535 per unit. A unit is comprised of either one share of common stock and related warrant or one share of preferred stock and related warrant. The aggregate gross proceeds were approximately $15 million and estimated net cash proceeds were approximately $13.6 million after offering fees and expenses, including the placement agent fee of approximately $1.1 million. We will file a Registration Statement on Form S-3 and expect to utilize net proceeds from the offering for working capital and general corporate purposes.
ITEM 6: SELECTED FINANCIAL DATA
As a smaller reporting company we are not required to provide this information.
ITEM 7: MANAGEMENT'S DISCUSSION AND ANALYSIS OF FINANCIAL CONDITION AND RESULTS OF OPERATIONS
The following discussion and analysis of our financial condition and results of operations should be read in conjunction with the audited financial statements and related notes included elsewhere in this Annual Report on Form 10-K. In addition to historical information, this discussion and analysis here and throughout this Form 10-K contains forward-looking statements that involve risks, uncertainties and assumptions. Our actual results may differ materially from those anticipated in these forward-looking statements.
Overview
Ideal Power is located in Austin, Texas. We design, market and sell electrical power conversion products using our proprietary technology called Power Packet Switching Architecture™, or PPSA™. PPSA™ is a power conversion technology that improves upon existing power conversion technologies in key product metrics, such as size and weight while providing built-in isolation and bi-directional and multi-port capabilities. PPSA™ utilizes standardized hardware with application specific embedded software. Our products are designed to be used in both on-grid and off-grid applications. Our advanced technology is important to our business and we make significant investments in research and development and protection of our intellectual property. Our PPSA™ and bi-directional switch technologies are protected by a patent portfolio of 50 US and 11 foreign issued patents at December 31, 2016.
We sell our products primarily to systems integrators as part of a larger turn-key system which enable end users to manage their electricity consumption, by reducing demand charges or fossil fuel consumption, integrating renewable energy sources and forming their own microgrid. Our products are made by contract manufacturers to our specifications, enabling us to scale production to meet demand on a cost-effective basis without requiring significant expenditures on manufacturing facilities and equipment. As our products establish a foothold in key power conversion markets, we may begin to focus on licensing our
proprietary PPSA™-based product designs to OEMs to reach more markets and customers. We may seek to build a portfolio of relationships that generate license fees and royalties from OEMs for sales of their products which integrate PPSA™.
We were founded on May 17, 2007. To date, operations have been funded primarily through the sale of common stock and, prior to our initial public offering, the issuance of convertible debt. Total revenue generated from inception to date as of December 31, 2016 amounted to $11,965,845 with approximately a quarter of that revenue coming from government grants. We may continue to pursue research and development grants, if and when available, for the purpose of developing new products and improving current products.
Critical Accounting Policies
The following discussion and analysis of financial condition and results of operations is based upon our financial statements, which have been prepared in conformity with accounting principles generally accepted in the United States of America. Certain accounting policies and estimates are particularly important to the understanding of our financial position and results of operations and require the application of significant judgment by our management or can be materially affected by changes from period to period in economic factors or conditions that are outside of our control. As a result, they are subject to an inherent degree of uncertainty. In applying these policies, we use our judgment to determine the appropriate assumptions to be used in the determination of certain estimates. Those estimates are based on our historical operations, our future business plans and projected financial results, the terms of existing contracts, our observance of trends in the industry, information provided by our customers and information available from other outside sources, as appropriate. Please see Footnote 2 to our financial statements for a more complete description of our critical accounting policies.
Revenue Recognition. Revenue from product sales is recognized when the risks of loss and title pass to the customer, as specified in (1) the respective sales agreements and (2) other revenue recognition criteria as prescribed by Staff Accounting Bulletin (“SAB”) No. 101, “Revenue Recognition in Financial Statements”, as amended by SAB No. 104, “Revenue Recognition”. We generally sell our products free-on-board shipping and recognize revenue when products are shipped.
Research and Development. Research and development costs are presented as a line item under operating expenses and are expensed as incurred.
Intangible Assets. Our intangible assets are primarily related to patents. We capitalize legal costs and filing fees, if any, associated with obtaining patents on our new inventions or other intangible assets. Once the asset have been issued or placed in service, we amortize these costs over the shorter of the legal life (generally a maximum of 20 years) or its estimated economic life using the straight-line method.
Income Taxes. We account for income taxes using an asset and liability approach that allows for the recognition and measurement of deferred tax assets based upon the likelihood of realization of tax benefits in future years. Under the asset and liability approach, deferred taxes are provided for the net tax effects of temporary differences between the carrying amounts of assets and liabilities for financial reporting purposes and the amounts used for income tax purposes. A valuation allowance is provided for deferred tax assets if it is more likely than not these items will either expire before we are able to realize their benefits, or that future deductibility is uncertain. Tax benefits from an uncertain tax position are recognized only if it is more likely than not that the tax position will be sustained on examination by the taxing authorities, based on the technical merits of the position.
Stock-Based Compensation. We apply Financial Accounting Standards Board (“FASB”) Accounting Standards Codification (“ASC”) 718, “Stock Compensation,” when recording stock based compensation. The fair value of each stock option award is estimated on the date of grant using the commonly used Black-Scholes option valuation model. The assumptions used in the Black-Scholes model are as follows:
Grant Price — The grant price is determined based on the closing share price on the date of grant.
Risk-free interest rate — The risk free interest rate is based on the implied yield available on US Treasury securities at the time of grant with an equivalent term of the expected life of the award.
Expected lives — As permitted by SAB 107, due to our insufficient history of option activity, we utilize the simplified approach to estimate the options’ expected term, calculated as the midpoint between the vesting period and the contractual life of the award.
Expected volatility — Volatility is estimated based on the historical volatilities of comparable companies.
Expected dividend yield — Dividend yield is based on current yield at the grant date or the average dividend yield over the historical period. We have never declared or paid dividends and have no plans to do so in the foreseeable future.
We use a Monte Carlo simulation pricing model to determine the fair value of performance stock units (“PSUs”). A typical Monte Carlo exercise simulates a distribution of stock prices to yield an expected distribution of stock prices during and at the end of the performance period. The simulations are repeated many times in order to derive a probabilistic assessment of stock performance. The stock-paths are simulated using assumptions which include expected stock price volatility and risk-free interest rate.
We account for stock issued to non-employees in accordance with the provisions of FASB ASC 505-50 “Equity Based Payments to Non-Employees.” FASB ASC 505-50 states that equity instruments that are issued in exchange for the receipt of goods or services should be measured at the fair value of the consideration received or the fair value of the equity instruments issued, whichever is more reliably measurable. The measurement date occurs as of the earlier of (a) the date at which a performance commitment is reached or (b) absent a performance commitment, the date at which the performance necessary to earn the equity instruments is complete (that is, the vesting date).
Results of Operations
Comparison of the year ended December 31, 2016 to the year ended December 31, 2015
Revenues. Revenues for the year ended December 31, 2016 of $1,628,740 were $2,631,169, or 62%, lower than the $4,259,909 we earned in revenues for the year ended December 31, 2015. The decrease in revenue was driven by disruption in the market for stand-alone storage. The significant decline in revenues was a result of delays in awards under California’s SGIP, which provides economic incentives for energy storage projects. The CPUC delayed announcing the 2016 awards as it examined and ultimately revised the award solicitation process and other aspects of the SGIP. The revised SGIP was not finalized until July 1, 2016, which delayed the determination of project winners and the processing of the related awards. These delays caused a temporary disruption in the market that impacted 2016 and likely, at least, part of 2017 as awarded projects may not be commissioned and installed until many months after the award is granted.
Cost of Revenues. Cost of revenues for the year ended December 31, 2016 of $1,939,712 was $1,932,960, or 50%, lower than the $3,872,672 cost of revenues for the year ended December 31, 2015 due to lower unit sales volumes and, to a lesser extent, production overhead, partially offset by charges of $334,889 associated with excess and obsolete, or E&O, inventory in connection with the end-of-life of our IBC-30 battery converter and $116,448 to increase our warranty reserve related primarily to our IBC-30 battery converter. We expect to sell-through existing inventory and not manufacture additional units of this product.
Gross Profit (Loss). Gross loss for the year ended December 31, 2016 was $310,972 compared to a gross profit of $387,237 for the year ended December 31, 2015. Gross loss for the year ended December 31, 2016 was primarily due to the IBC-30 E&O charge and additional warranty accrual recognized in the year ended December 31, 2016, as well as lower product sales compared to the year ended December 31, 2015.
Research and Development Expenses. Research and development expenses decreased by $296,398, or 5%, to $5,224,992 in the year ended December 31, 2016 from $5,521,390 in the year ended December 31, 2015. The decrease was primarily due to lower costs associated with bi-directional power switch development costs of $764,459 and external product development costs of $273,989, partially offset by higher personnel costs of $712,766 as we added both firmware and hardware engineering resources, compared to the year ended December 31, 2015.
General and Administrative Expenses. General and administrative expenses increased by $50,490, or 1%, to $3,743,940 in the year ended December 31, 2016 from $3,693,450 in the year ended December 31, 2015.
Sales and Marketing Expenses. Sales and marketing expenses increased by $92,721, or 6%, to $1,737,233 in the year ended December 31, 2016 from $1,644,512 in the year ended December 31, 2015. The increase was due primarily to higher consulting costs of $67,022 and trade show costs of $36,045 compared to the year ended December 31, 2015.
Loss from Operations. Due to the decrease in our gross profit, our loss from operations for the year ended December 31, 2016 was $11,017,137 or 5% higher than the $10,472,115 loss from operations for year ended December 31, 2015.
Interest Income. Interest income increased to $36,046 for the year ended December 31, 2016 compared to $31,472 for the year ended December 31, 2015.
Net Loss. As a result of the increase in our loss from operations, our net loss for the year ended December 31, 2016, was $10,981,091 as compared to a net loss of $10,440,643 for the year ended December 31, 2015, an increase of $540,448.
Liquidity and Capital Resources
We currently do not generate enough revenue to sustain our operations. Our revenues in the year ended December 31, 2016 were solely generated from sales of our products. We have primarily funded our operations through the sale of common stock and, prior to our initial public offering, the issuance of convertible debt.
As of December 31, 2016 and 2015, we had cash and cash equivalents of $4,204,916 and $15,022,286, respectively. Our net working capital decreased to $4,645,418 as of December 31, 2016 from $14,260,603 as of December 31, 2015 due primarily to cash used in operations.
Operating activities in the year ended December 31, 2016 resulted in cash outflows of $10,098,653, which were due to the net loss for the period of $10,981,091 and unfavorable balance sheet timing of $1,364,473, offset by stock-based compensation of $1,517,545, depreciation and amortization of $406,639 and other non-cash items of $322,727. Operating activities in the year ended December 31, 2015 resulted in cash outflows of $8,046,217, which were due to the net loss for the period of $10,440,643, offset by stock-based compensation of $1,384,763, favorable balance sheet timing of $395,021, other non-cash items of $381,790 and depreciation and amortization of $232,852.
Investing activities in the years ended December 31, 2016 and 2015 resulted in cash outflows of $750,992 and $1,421,741, respectively. Cash outflows for the acquisition of fixed assets in the years ended December 31, 2016 and 2015 were $391,088 and $791,605, respectively, and cash outflows for the acquisition of intangible assets in the years ended December 31, 2016 and 2015 were $359,904 and $630,136, respectively.
Financing activities in the year ended December 31, 2016 resulted in cash inflows of $32,275 primarily related to net proceeds from the exercise of options and warrants. In the year ended December 31, 2015 financing activities resulted in cash inflows of $16,578,233, related primarily to the issuance of 2,225,825 shares of common stock shares at a public offering price of $7.75. Net cash proceeds after offering-related expenses were $15,924,405. In addition, we received $653,828 in net proceeds from the exercise of options and warrants.
In March 2017, we completed a private placement for an aggregate 5,220,826 shares of common stock and 708,430 shares of preferred stock together with warrants to purchase 5,929,256 shares of common stock at a price of $2.535 per unit. A unit is comprised of either one share of common stock and related warrant or one share of preferred stock and related warrant. The aggregate gross proceeds were approximately $15 million and estimated net cash proceeds were approximately $13.6 million after offering fees and expenses, including the placement agent fee of approximately $1.1 million. We will file a Registration Statement on Form S-3 and expect to utilize net proceeds from the offering for working capital and general corporate purposes.
On December 1, 2014, we filed a Form S-3 shelf registration statement with the Securities and Exchange Commission. The registration statement allows us to offer up to an aggregate $75 million of common stock, preferred stock, warrants to purchase common stock or preferred stock or any combination thereof and provides us with the flexibility over three years to potentially raise additional equity in a public or private offering on commercial terms. After the May 2015 follow-on offering, $58 million is available to the Company under the registration statement.
Off-Balance Sheet Transactions
We do not have any off-balance sheet transactions.
Trends, Events and Uncertainties
Research and development of new technologies is, by its nature, unpredictable. Although we will undertake development efforts with commercially reasonable diligence, there can be no assurance that our working capital of $4,645,418 as of December 31, 2016 and the estimated net proceeds of approximately $13.6 million from our March 2017 private placement will be sufficient to enable us to develop our technology to the extent needed to create future sales to sustain operations as contemplated herein. If our working capital is insufficient for this purpose, we will consider other options to continue our path to commercialization, including, but not limited to, additional financing through follow-on stock offerings, debt financing, co-
development agreements, curtailment of operations, suspension of operations, sale or licensing of developed intellectual property, or other alternatives.
We cannot assure you that our technology will be adopted, that we will ever earn revenues sufficient to support our operations, or that we will ever be profitable. Furthermore, since we have no committed source of financing, we cannot assure you that we will be able to raise money as and when we need it to continue our operations. If we cannot raise funds as and when we need them, we may be required to severely curtail, or even to cease, our operations.
Other than as discussed above and elsewhere in this report, we are not aware of any trends, events or uncertainties that are likely to have a material effect on our financial condition.
ITEM 7A: QUANTITATIVE AND QUALITATIVE DISCLOSURES ABOUT MARKET RISK
As a smaller reporting company we are not required to provide this information.
ITEM 8: FINANCIAL STATEMENTS AND SUPPLEMENTARY DATA
REPORT OF INDEPENDENT REGISTERED PUBLIC ACCOUNTING FIRM
To the Board of Directors and Stockholders of Ideal Power Inc.
We have audited the accompanying balance sheets of Ideal Power Inc. (the “Company”) as of December 31, 2016 and 2015, and the related statements of operations, stockholders’ equity, and cash flows for each of the years in the two-year period ended December 31, 2016. The Company’s management is responsible for these financial statements. Our responsibility is to express an opinion on these financial statements based on our audits.
We conducted our audits in accordance with the standards of the Public Company Accounting Oversight Board (United States). Those standards require that we plan and perform the audit to obtain reasonable assurance about whether the financial statements are free of material misstatement. The Company is not required to have, nor were we engaged to perform, an audit of its internal control over financial reporting. Our audits included consideration of internal control over financial reporting as a basis for designing audit procedures that are appropriate in the circumstances, but not for the purpose of expressing an opinion on the effectiveness of the Company’s internal control over financial reporting. Accordingly, we express no such opinion. An audit also includes examining, on a test basis, evidence supporting the amounts and disclosures in the financial statements, assessing the accounting principles used and significant estimates made by management, as well as evaluating the overall financial statement presentation. We believe that our audits provide a reasonable basis for our opinion.
In our opinion, the financial statements referred to above present fairly, in all material respects, the financial position of the Company as of December 31, 2016 and 2015, and the results of its operations and its cash flows for each of the years in the two-year period ended December 31, 2016, in conformity with accounting principles generally accepted in the United States of America.
/s/ Gumbiner Savett Inc.
March 29, 2017
Santa Monica, California
IDEAL POWER INC.
Balance Sheets
|
| | | | | | | |
| December 31, |
| 2016 | | 2015 |
ASSETS | |
| | |
|
Current assets: | |
| | |
|
Cash and cash equivalents | $ | 4,204,916 |
| | $ | 15,022,286 |
|
Accounts receivable, net | 378,658 |
| | 872,874 |
|
Inventories, net | 1,245,147 |
| | 648,009 |
|
Prepayments and other current assets | 312,593 |
| | 296,355 |
|
Total current assets | 6,141,314 |
| | 16,839,524 |
|
| | | |
Property and equipment, net | 936,486 |
| | 925,899 |
|
Intangible assets, net | 1,905,556 |
| | 1,466,811 |
|
Other assets | 17,920 |
| | 17,920 |
|
Total assets | $ | 9,001,276 |
| | $ | 19,250,154 |
|
LIABILITIES AND STOCKHOLDERS’ EQUITY | |
| | |
|
Current liabilities: | |
| | |
|
Accounts payable | $ | 346,767 |
| | $ | 1,338,828 |
|
Accrued expenses | 1,149,129 |
| | 1,240,093 |
|
Total current liabilities | 1,495,896 |
| | 2,578,921 |
|
| | | |
Long-term liabilities | 265,418 |
| | — |
|
Total liabilities | 1,761,314 |
| | 2,578,921 |
|
| | | |
Commitments |
|
| |
|
|
| | | |
Stockholders’ equity: | |
| | |
|
Common stock, $0.001 par value; 50,000,000 shares authorized; 9,560,896 shares issued and 9,559,213 shares outstanding at December 31, 2016, and 9,550,544 shares issued and 9,549,544 shares outstanding at December 31, 2015 | 9,561 |
| | 9,550 |
|
Additional paid-in capital | 52,310,481 |
| | 50,757,414 |
|
Treasury stock, at cost, 1,683 and 1,000 shares at December 31, 2016 and 2015, respectively | (5,915 | ) | | (2,657 | ) |
Accumulated deficit | (45,074,165 | ) | | (34,093,074 | ) |
Total stockholders’ equity | 7,239,962 |
| | 16,671,233 |
|
Total liabilities and stockholders’ equity | $ | 9,001,276 |
| | $ | 19,250,154 |
|
The accompanying notes are an integral part of these financial statements.
IDEAL POWER INC.
Statements of Operations
|
| | | | | | | |
| For the Year Ended
December 31, |
| 2016 | | 2015 |
| | | |
Product revenue | $ | 1,628,740 |
| | $ | 4,259,909 |
|
Cost of product revenue | 1,939,712 |
| | 3,872,672 |
|
Gross profit (loss) | (310,972 | ) | | 387,237 |
|
| | | |
Operating expenses: | |
| | |
|
Research and development | 5,224,992 |
| | 5,521,390 |
|
General and administrative | 3,743,940 |
| | 3,693,450 |
|
Sales and marketing | 1,737,233 |
| | 1,644,512 |
|
Total operating expenses | 10,706,165 |
| | 10,859,352 |
|
Loss from operations | (11,017,137 | ) | | (10,472,115 | ) |
Interest income | 36,046 |
| | 31,472 |
|
Net loss | $ | (10,981,091 | ) | | $ | (10,440,643 | ) |
| | | |
Net loss per share – basic and fully diluted | $ | (1.15 | ) | | $ | (1.23 | ) |
| | | |
Weighted average number of shares outstanding – basic and fully diluted | 9,548,381 |
| | 8,495,735 |
|
The accompanying notes are an integral part of these financial statements.
IDEAL POWER INC.
Statement of Stockholders’ Equity
For the Years Ended December 31, 2016 and 2015
|
| | | | | | | | | | | | | | | | | | | | | | | | | |
| Common Stock | | Additional Paid-In
Capital | | Treasury Stock | | Accumulated
Deficit | | Total Stockholders’
Equity (Deficit) |
| Shares | | Amount | | | | Shares | | Amount | | | | |
Balances at December 31, 2014 | 7,049,235 |
| | $ | 7,048 |
| | $ | 32,712,020 |
| | 1,000 |
| | $ | (2,657 | ) | | $ | (23,652,431 | ) | | $ | 9,063,980 |
|
Shares issued in offering, net of issuance costs | 2,225,825 |
| | 2,226 |
| | 15,922,179 |
| | — |
| | — |
| | — |
| | 15,924,405 |
|
Exercise of options and warrants | 265,484 |
| | 266 |
| | 653,562 |
| | — |
| | — |
| | — |
| | 653,828 |
|
Warrants issued for consulting services | — |
| | — |
| | 84,900 |
| | — |
| | — |
| | — |
| | 84,900 |
|
Issuance of restricted stock | 10,000 |
| | 10 |
| | (10 | ) | | — |
| | — |
| | — |
| | — |
|
Stock-based compensation | — |
| | — |
| | 1,384,763 |
| | — |
| | — |
| | — |
| | 1,384,763 |
|
Net loss for the year ended December 31, 2015 | — |
| | — |
| | — |
| | — |
| | — |
| | (10,440,643 | ) | | (10,440,643 | ) |
Balances at December 31, 2015 | 9,550,544 |
| | $ | 9,550 |
| | $ | 50,757,414 |
| | 1,000 |
| | $ | (2,657 | ) | | $ | (34,093,074 | ) | | $ | 16,671,233 |
|
Exercise of options and warrants | 10,352 |
| | 11 |
| | 35,522 |
| | — |
| | — |
| | — |
| | 35,533 |
|
Common stock tendered to pay taxes on restricted stock vesting | — |
| | — |
| | — |
| | 683 |
| | (3,258 | ) | | — |
| | (3,258 | ) |
Stock-based compensation | — |
| | — |
| | 1,517,545 |
| | — |
| | — |
| | — |
| | 1,517,545 |
|
Net loss for the year ended December 31, 2016 | — |
| | — |
| | — |
| | — |
| | — |
| | (10,981,091 | ) | | (10,981,091 | ) |
Balances at December 31, 2016 | 9,560,896 |
| | $ | 9,561 |
| | $ | 52,310,481 |
| | 1,683 |
| | $ | (5,915 | ) | | $ | (45,074,165 | ) | | $ | 7,239,962 |
|
The accompanying notes are an integral part of these financial statements.
IDEAL POWER INC.
Statements of Cash Flows
|
| | | | | | | |
| For the Year Ended December 31, |
| 2016 | | 2015 |
Cash flows from operating activities: | |
| | |
|
Net loss | $ | (10,981,091 | ) | | $ | (10,440,643 | ) |
Adjustments to reconcile net loss to net cash used in operating activities: | |
| | |
|
Allowance for doubtful accounts | 85,375 |
| | 97,344 |
|
Write-down of inventory | 72,823 |
| | — |
|
Depreciation and amortization | 406,639 |
| | 232,852 |
|
Write-off of fixed assets | 47,560 |
| | 53,855 |
|
Write-off of capitalized patents | 116,969 |
| | 145,691 |
|
Stock-based compensation | 1,517,545 |
| | 1,384,763 |
|
Fair value of warrants issued for services | — |
| | 84,900 |
|
Decrease (increase) in operating assets: | |
| | |
|
Accounts receivable | 408,841 |
| | (523,697 | ) |
Inventories | (679,993 | ) | | (412,698 | ) |
Prepaid expenses and other assets | (16,238 | ) | | (32,750 | ) |
Increase (decrease) in operating liabilities: | |
| | |
|
Accounts payable | (992,061 | ) | | 897,192 |
|
Accrued expenses | (85,022 | ) | | 466,974 |
|
Net cash used in operating activities | (10,098,653 | ) | | (8,046,217 | ) |
Cash flows from investing activities: | |
| | |
|
Purchase of property and equipment | (391,088 | ) | | (791,605 | ) |
Acquisition of intangible assets | (359,904 | ) | | (630,136 | ) |
Net cash used in investing activities | (750,992 | ) | | (1,421,741 | ) |
Cash flows from financing activities: | |
| | |
|
Net proceeds from issuance of common stock | — |
| | 15,924,405 |
|
Exercise of options and warrants | 35,533 |
| | 653,828 |
|
Payment of taxes related to restricted stock vesting | (3,258 | ) | | — |
|
Net cash provided by financing activities | 32,275 |
| | 16,578,233 |
|
Net increase (decrease) in cash and cash equivalents | (10,817,370 | ) | | 7,110,275 |
|
Cash and cash equivalents at beginning of year | 15,022,286 |
| | 7,912,011 |
|
Cash and cash equivalents at end of year | $ | 4,204,916 |
| | $ | 15,022,286 |
|
The accompanying notes are an integral part of these financial statements.
Ideal Power Inc.
Notes to Financial Statements
Note 1 — Organization and Description of Business
Ideal Power Inc. (the “Company”) was incorporated in Texas on May 17, 2007 under the name Ideal Power Converters, Inc. The Company changed its name to Ideal Power Inc. on July 8, 2013 and re-incorporated in Delaware on July 15, 2013. With headquarters in Austin, Texas, it develops power conversion solutions with an initial focus on stand-alone commercial and industrial grid storage, combined solar and storage, and microgrid applications. The principal products of the Company are power conversion systems, including 2-port and multi-port products.
Since its inception, the Company has generated limited revenues from the sale of products and has financed its research and development efforts and operations primarily through the sale of common stock and, prior to its initial public offering, the issuance of convertible debt.
Note 2 — Summary of Significant Accounting Policies
Basis of Presentation
The preparation of financial statements in conformity with US GAAP requires management to make certain estimates and assumptions that affect the reported amounts of assets and liabilities and disclosure of contingent assets and liabilities at the date of the financial statements and the reported amounts of revenues and expenses during the reporting period. Actual results could differ from those estimates.
Cash and Cash Equivalents
The Company considers all highly liquid investments purchased with an original maturity of three months or less to be cash equivalents.
Accounts Receivable
Trade accounts receivable are stated net of an allowance for doubtful accounts. The Company performs ongoing credit evaluations of its customers’ financial condition. In limited instances, the Company may require an upfront deposit and, in most cases, the Company charges interest on past due amounts. Management estimates the allowance for doubtful accounts based on review and analysis of specific customer balances that may not be collectible, customer payment history and any other customer-specific information that may impact the evaluation of the specific customer’s credit. Accounts are considered for write-off when they become past due and it is determined that the probability of collection is remote. The allowance for doubtful accounts was $85,375 and $15,145 at December 31, 2016 and 2015, respectively.
Inventories
Inventories are stated at the lower of cost (first in, first out method) or market value. Inventory quantities on hand are reviewed regularly and a write-down for excess and obsolete inventory is recorded based primarily on an estimated forecast of product demand, market conditions and anticipated production requirements in the near future. There was a $59,969 and $4,274 reserve for excess and obsolete inventory at December 31, 2016 and 2015, respectively, related to component parts not anticipated to have a future use.
Property and Equipment
Property and equipment are stated at historical cost less accumulated depreciation and amortization. Major additions and improvements are capitalized while maintenance and repairs that do not improve or extend the useful life of the respective asset are expensed. Depreciation and amortization of property and equipment is computed using the straight-line method over their estimated useful lives. Leasehold improvements are amortized over the shorter of the life of the asset or the related leases. Estimated useful lives of the principal classes of assets are as follows:
|
| | |
Leasehold improvements | | Shorter of lease term or useful life |
Machinery and equipment | | 5 years |
Furniture, fixtures and computers | | 3 – 5 years |
Intangible Assets
The Company’s intangible assets are primarily composed of patents, which are recorded at cost. The Company capitalizes third party legal costs and filing fees, if any, associated with obtaining patents or other intangible assets. Once the intangible asset has been placed in service, the Company amortizes these costs over the shorter of the asset’s legal life, generally 20 years, or its estimated economic life using the straight-line method.
Impairment of Long-Lived Assets
The long-lived assets, consisting of property and equipment and intangible assets, held and used by the Company are reviewed for impairment no less frequently than annually or whenever events or changes in circumstances indicate that the carrying amount of an asset may not be recoverable. In the event that facts and circumstances indicate that the cost of any long-lived assets may be impaired, an evaluation of recoverability is performed. Management has determined that there was an impairment in the value of long-lived assets in the amount of $164,529 and $199,546 during the years ended December 31, 2016 and 2015, respectively.
Fair Value
Fair value is the price that would be received to sell an asset or paid to transfer a liability in an orderly transaction between market participants at the measurement date. Assets and liabilities measured at fair value are categorized based on whether or not the inputs are observable in the market and the degree that the inputs are observable. The categorization of financial assets and liabilities within the valuation hierarchy is based upon the lowest level of input that is significant to the fair value measurement. The three levels of inputs used to establish fair value are the following:
| |
• | Level 1 — Quoted prices in active markets for identical assets or liabilities; |
| |
• | Level 2 — Inputs other than Level 1 that are observable, either directly or indirectly, such as quoted prices for similar assets or liabilities; quoted prices in markets that are not active; or other inputs that are observable or can be corroborated by observable market data for substantially the full term of the assets or liabilities; and |
| |
• | Level 3 — Unobservable inputs that are supported by little or no market activity and that are significant to the fair value of the assets or liabilities |
The Company’s financial instruments primarily consist of cash and cash equivalents, accounts receivable, accounts payable and long-term liabilities. As of the balance sheet dates, the estimated fair values of the financial instruments were not materially different from their carrying values as presented on the balance sheets. This is primarily attributed to the short-term nature of these instruments.
In 2016, the Company recorded long-term liability for the estimated present value of future payments under a licensing agreement. The Company determined the discount rate to estimate the present value of the future payments based on the applicable treasury rates. The Company's long-term liability is classified within Level 3. See Footnote 7 and Footnote 13 for more details regarding the licensing agreement. The Company did not identify any other assets and liabilities that are required to be presented in the balance sheets at fair value.
Revenue Recognition
Revenue from product sales is recognized when the risks of loss and title pass to the customer, as specified in (1) the respective sales agreements and (2) other revenue recognition criteria as prescribed by Staff Accounting Bulletin (“SAB”) No. 101 (SAB 101), “Revenue Recognition in Financial Statements,” as amended by SAB No. 104, “Revenue Recognition”. The Company generally sells its products FOB shipping and recognizes revenue when products are shipped.
Product Warranties
The Company generally provides a ten-year limited warranty on its products except for its product for the PV + storage market for which the Company provides a five-year limited warranty. Accruals for product warranties are estimated based upon limited historical warranty experience, engineering experience and judgment, and third party assessments of the reliability of the Company’s 30kW products. Accruals for product warranties are recorded in cost of product revenue at the time revenue is recognized in order to match revenues with related expenses. The Company assesses the adequacy of its estimated warranty liability quarterly and adjusts the reserve, included in accrued expenses, as necessary. For the year ended December 31, 2016, the Company recorded a warranty accrual adjustment of $116,448 primarily associated with the Company's IBC-30 battery converter. For the year ended December 31, 2015, no warranty accrual adjustments were recorded. Warranty adjustments could be material in the future if estimates differ significantly from actual warranty experience.
Research and Development
Research and development costs are presented as a line item under operating expenses and are expensed as incurred.
Income Taxes
The Company accounts for income taxes using an asset and liability approach which allows for the recognition and measurement of deferred tax assets based upon the likelihood of realization of tax benefits in future years. Under the asset and liability approach, deferred taxes are provided for the net tax effects of temporary differences between the carrying amounts of assets and liabilities for financial reporting purposes and the amounts used for income tax purposes. A valuation allowance is provided for deferred tax assets if it is more likely than not these items will either expire before the Company is able to realize their benefits, or that future deductibility is uncertain. At December 31, 2016 and 2015, the Company has established a full reserve against all deferred tax assets.
Tax benefits from an uncertain tax position are recognized only if it is more likely than not that the tax position will be sustained on examination by the taxing authorities based on the technical merits of the position. The tax benefits recognized in the financial statements from such a position are measured based on the largest benefit that has a greater than 50 percent likelihood of being realized upon ultimate resolution.
Net Loss Per Share
The Company applies Financial Accounting Standards Board (“FASB”) Accounting Standards Codification (“ASC”) 260, “Earnings per Share.” Basic earnings (loss) per share is computed by dividing earnings (loss) available to common stockholders by the weighted-average number of common shares outstanding. Diluted earnings (loss) per share is computed similar to basic earnings (loss) per share except that the denominator is increased to include additional common shares available upon exercise of equity awards and warrants using the treasury stock method. In periods with a net loss, no common share equivalents are included because their effect would be anti-dilutive. At December 31, 2016 and 2015, potentially dilutive shares outstanding amounted to 3,006,357 and 2,846,325, respectively.
Stock Based Compensation
The Company applies FASB ASC 718, “Stock Compensation,” when recording stock based compensation. The fair value of each stock option award is estimated on the date of grant using the Black-Scholes option valuation model.
The Company uses a Monte Carlo simulation pricing model to determine the fair value of performance stock units (“PSUs”). A typical Monte Carlo exercise simulates a distribution of stock prices to yield an expected distribution of stock prices during and at the end of the performance period. The simulations are repeated many times in order to derive a probabilistic assessment of stock performance. The stock-paths are simulated using assumptions which include expected stock price volatility and risk-free interest rate.
The Company accounts for stock issued to non-employees in accordance with the provisions of FASB ASC 505-50 “Equity Based Payments to Non-Employees.” FASB ASC 505-50 states that equity instruments that are issued in exchange for the receipt of goods or services should be measured at the fair value of the consideration received or the fair value of the equity instruments issued, whichever is more reliably measurable. The measurement date occurs as of the earlier of (a) the date at which a performance commitment is reached or (b) absent a performance commitment, the date at which the performance necessary to earn the equity instruments is complete (that is, the vesting date).
The Company issues common stock upon exercise of equity awards and warrants.
Presentation of Sales Taxes
Certain states impose a sales tax on the Company’s sales to nonexempt customers. The Company collects that sales tax from customers and remits the entire amount to the states. The Company’s accounting policy is to exclude the tax collected and remitted to the states from revenues and cost of revenues.
Concentration of Credit Risk
Financial instruments that potentially subject the Company to concentrations of credit risk consist primarily of cash and cash equivalents and accounts receivable. The Company maintains its cash with a major financial institution located in the United States. Balances are insured by the Federal Deposit Insurance Corporation up to $250,000. The Company maintains balances in excess of federally insured limits. The Company has not experienced losses in such accounts and believes it is not exposed to significant credit risk regarding its cash and cash equivalents.
The Company encounters a certain amount of risk as a result of a concentration of revenue from a few significant customers. Credit is extended to customers based on an evaluation of their financial condition. In limited instances, the Company may require an upfront deposit and, in most cases, the Company charges interest on past due amounts. The Company performs ongoing credit evaluations of its customers and records an allowance for potential bad debts based on available information.
The Company had revenue from two customers that accounted for 44% of product revenue for the year ended December 31, 2016, and from four customers that accounted for 66% of product revenue for the year ended December 31, 2015. The Company had an accounts receivable balance from two customers that accounted for 78% and three customers that accounted for 66% of trade receivables at December 31, 2016 and 2015, respectively.
Reclassifications
Certain items in prior financial statements have been reclassified to conform to current year presentation. These changes did not impact total revenue, loss from operations or net loss.
Recently Adopted Standards
In August 2014, the FASB issued Accounting Standards Update No. 2014-15 (ASU 2014-15), Presentation of Financial Statements – Going Concern (Subtopic 205-10). ASU 2014-15 provides guidance as to management’s responsibility to evaluate whether there is substantial doubt about an entity’s ability to continue as a going concern and to provide related footnote disclosures. Substantial doubt about an entity’s ability to continue as a going concern exists when relevant conditions and events, considered in the aggregate, indicate that it is probable that the entity will be unable to meet its obligations as they become due within one year after the date that the financial statements are issued (or available to be issued). ASU 2014-15 is effective for the annual period ending after December 15, 2016, and for annual periods and interim periods thereafter.
In March 2016, the FASB issued ASU 2016-09, Improvements to Employee Share-Based Payment Accounting (Topic 718), a new standard that changes the accounting for certain aspects of share-based payments to employees. The new guidance requires excess tax benefits and tax deficiencies to be recorded in the income statement when the awards vest or are settled. In addition, cash flows related to excess tax benefits will no longer be separately classified as a financing activity apart from other income tax cash flows. The standard also allows the Company to repurchase more of an employee’s shares for tax withholding purposes without triggering liability accounting, clarifies that all cash payments made on an employee’s behalf for withheld shares should be presented as a financing activity on the Company's cash flows statement, and provides an accounting policy election to account for forfeitures as they occur. The new standard is effective for the Company beginning January 1, 2017, with early adoption permitted. The Company elected early adoption of the ASU and made the policy election to account for forfeitures as they occur. The adoption of this standard did not have a significant effect on the Company’s financial statements.
Recent Accounting Pronouncements
In May 2014, the FASB issued Accounting Standards Update (“ASU”) 2014-09, Revenue from Contracts with Customers (Topic 606), requiring an entity to recognize the amount of revenue to which it expects to be entitled for the transfer of promised goods or services to customers. The FASB has recently issued several amendments to the standard, including clarification on accounting for licenses of intellectual property and identifying performance obligations. The standard will replace most existing revenue recognition guidance in U.S. GAAP when it becomes effective and permits the use of either the retrospective or cumulative effect transition method. The updated standard becomes effective for annual and interim periods beginning after December 15, 2017 and early adoption is permitted. The adoption of the standard is not expected to have a significant effect on the Company’s financial statements.
In February 2016, the FASB issued ASU 2016-02, Leases (Topic 842), a new standard related to leases to increase transparency and comparability among organizations by requiring the recognition of lease assets and lease liabilities on the balance sheet. Most prominent among the amendments is the recognition of assets and liabilities by lessees for those leases classified as operating leases under previous U.S. GAAP. Under the new standard, disclosures are required to meet the objective of enabling users of financial statements to assess the amount, timing, and uncertainty of cash flows arising from leases. The new standard will be effective for annual and interim periods beginning after December 15, 2018, with early adoption permitted. While the Company is continuing to assess the potential impact of this standard, it expects at least a portion of its lease commitments will be subject to the updated standard and recognized as lease liabilities and right-of-use assets upon adoption.
In August 2016, the FASB issued ASU 2016-15, Statement of Cash Flows (Topic 230), in order to address eight specific cash flow issues with the objective of reducing the existing diversity in practice. The updated standard is effective for financial statements issued for annual periods beginning after December 15, 2017 and interim periods within those fiscal years with early adoption permitted. The Company is currently evaluating the impact of the standard, but does not expect it to have a material effect on the financial statements.
Management does not believe that any other recently issued, but not yet effective, accounting standards, if adopted, will have a material effect on the financial statements.
Note 3 — Accounts Receivable
Accounts receivable, net consisted of the following:
|
| | | | | | | | |
| | December 31, |
| | 2016 | | 2015 |
Trade receivables | | $ | 430,278 |
| | $ | 803,599 |
|
Other receivables | | 33,755 |
| | 84,420 |
|
| | 464,033 |
| | 888,019 |
|
Allowance for doubtful accounts | | (85,375 | ) | | (15,145 | ) |
| | $ | 378,658 |
| | $ | 872,874 |
|
Note 4 — Inventories
Inventories, net consisted of the following:
|
| | | | | | | | |
| | December 31, |
| | 2016 | | 2015 |
Raw materials | | $ | 363,195 |
| | $ | 124,498 |
|
Finished goods | | 941,921 |
| | 527,785 |
|
| | 1,305,116 |
| | 652,283 |
|
Reserve for obsolescence | | (59,969 | ) | | (4,274 | ) |
| | $ | 1,245,147 |
| | $ | 648,009 |
|
In 2016, the Company recorded a charge of $334,889 for excess and obsolete inventory in connection with the end-of-life of the Company’s IBC-30 battery converter. The cash component of the charge is primarily related to excess IBC-30 component inventory held by the Company's contract manufacturer and amounted to $297,985.
Note 5 — Prepayments and Other Current Assets
Prepayments and other current assets consisted of the following:
|
| | | | | | | | |
| | December 31, |
| | 2016 | | 2015 |
Prepaid insurance | | $ | 172,163 |
| | $ | 168,481 |
|
Prepaid software | | 68,682 |
| | 59,874 |
|
Other | | 71,748 |
| | 68,000 |
|
| | $ | 312,593 |
| | $ | 296,355 |
|
Note 6 — Property and Equipment
Property and equipment, net consisted of the following:
|
| | | | | | | | |
| | December 31, |
| | 2016 | | 2015 |
Machinery and equipment | | $ | 894,228 |
| | $ | 676,881 |
|
Building leasehold improvements | | 395,335 |
| | 362,300 |
|
Furniture, fixtures, software and computers | | 228,011 |
| | 195,497 |
|
| | 1,517,574 |
| | 1,234,678 |
|
Accumulated depreciation and amortization | | (581,088 | ) | | (308,779 | ) |
| | $ | 936,486 |
| | $ | 925,899 |
|
Note 7 — Intangible Assets
Intangible assets, net consisted of the following:
|
| | | | | | | | |
| | December 31, |
| | 2016 | | 2015 |
Patents | | $ | 1,556,204 |
| | $ | 1,313,269 |
|
Other intangible assets | | 470,870 |
| | 211,394 |
|
| | 2,027,074 |
| | 1,524,663 |
|
Accumulated amortization | | (121,518 | ) | | (57,852 | ) |
| | $ | 1,905,556 |
| | $ | 1,466,811 |
|
In 2015, the Company entered into licensing agreements which expire on February 7, 2033. The agreements provide the Company an exclusive royalty-free license associated with semiconductor power switches which enhances its intellectual property portfolio. In 2015, the Company recorded legal and acquisition costs of $211,394 associated with the licensing agreements as other intangible assets.
In 2016, the Company recorded an additional $259,476, associated with a patent issuance under the licensing agreements, as an other intangible asset. This amount represents the estimated present value of all future payments associated with the issued patent. The Company is amortizing the capitalized costs of the other intangible assets over the 17-year term of the agreements using the straight-line method. For further discussion of the licensing agreement, see Footnote 13.
Amortization expense amounted to $63,666 and $30,597 for the years ended December 31, 2016 and 2015, respectively. Amortization expense for the succeeding five years and thereafter is $71,379 (2017); $71,379 (2018); $71,379 (2019); $71,379 (2020); $71,379 (2021); and $870,251 (thereafter).
At December 31, 2016 and 2015, the Company had capitalized approximately $678,410 and $612,000, respectively, for costs related to patents that have not been awarded.
Note 8 — Accrued Expenses
Accrued expenses consisted of the following:
|
| | | | | | | | |
| | December 31, |
| | 2016 | | 2015 |
Accrued compensation | | $ | 519,485 |
| | $ | 616,029 |
|
Warranty reserve | | 335,893 |
| | 358,296 |
|
Other | | 293,751 |
| | 265,768 |
|
| | $ | 1,149,129 |
| | $ | 1,240,093 |
|
The changes in warranty reserve were as follows:
|
| | | | | | | | |
| | 2016 | | 2015 |
Balance, beginning of the year | | $ | 358,296 |
| | $ | 143,364 |
|
Provisions for warranty and beta replacements | | 222,408 |
| | 235,377 |
|
Warranty payments or beta replacements | | (244,811 | ) | | (20,445 | ) |
Balance, end of the year | | $ | 335,893 |
| | $ | 358,296 |
|
Note 9 — Common Stock
All shares of common stock have a par value of $0.001. Each holder of common stock is entitled to one vote per share outstanding.
During the year ended December 31, 2016, common stock activity consisted of the exercise of options and warrants for an aggregate 10,352 shares of the Company’s common stock for proceeds of $35,533.
During the year ended December 31, 2015, the Company completed an underwritten follow-on offering of 2,225,825 shares, inclusive of the underwriter’s overallotment of 290,325 shares, of its common stock. Gross proceeds were $17,250,144 before underwriting discounts and offering expenses. Net cash proceeds were $15,924,405 after offering fees and expenses of $1,325,739, including the underwriting discount of $1,035,008 and other costs of $290,731. In addition, common stock activity included the exercise of options and warrants for an aggregate 265,484 shares of the Company’s common stock for net proceeds of $653,828. The Company also granted 10,000 restricted shares of common stock to an employee as a performance award.
On December 1, 2014, the Company filed a Form S-3 shelf registration statement with the Securities and Exchange Commission. The registration statement allows the Company to offer up to an aggregate $75 million of common stock, preferred stock, warrants to purchase common stock or preferred stock or any combination thereof. After the May 2015 follow-on offering, $58 million is available to the Company under the registration statement.
Note 10 — Stock Option Plan
On May 17, 2013, the Company adopted the 2013 Equity Incentive Plan (the “Plan”) and reserved shares of common stock for issuance under the Plan not to exceed a maximum of 839,983 shares. In 2015, the stockholders approved an amendment to the Plan which increased shares available for issuance under the Plan by 1,250,000 shares and the Plan was restated in order to clarify the types of awards allowable under the plan to include restricted stock and PSUs. The Plan is administered by the Compensation Committee of the Company’s Board of Directors. The persons eligible to participate in the Plan are employees
(including officers), members of the Board of Directors, consultants and other independent advisors and contractors who provide services to the Company. Options issued under the Plan may have a term of up to ten years and may have variable vesting. The typical vesting schedule for stock options awarded under the Plan is a four year annual vesting schedule for employees and a one-year quarterly vesting schedule for Board members.
At December 31, 2016, there were 655,127 shares of common stock available for issuance under the Plan.
During the year ended December 31, 2016, the Company granted 58,200 and 37,938 stock options to purchase shares of common stock to employees and non-employee directors, respectively. The exercise price of the stock options issued to both employees and directors was the closing price of the Company’s stock on the date of grant. The options granted to employees vest in equal annual installments over four years while the options granted to directors vested in equal quarterly installments in 2016. The options granted in 2016 were valued at $294,132 using the Black-Scholes option pricing model. The compensation expense associated with these grants recognized during the year ended December 31, 2016 amounted to $160,519.
During the year ended December 31, 2016, the Company also granted 119,000 PSUs, which are subject to the satisfaction of certain market-based and continued service conditions. The market-based vesting criteria are separated into four tranches and require that the Company achieve certain stock price targets ranging from $10 per share to $16 per share during the four-year period following the grant date. With certain limited exceptions, continued employment with the Company on the fourth anniversary of the grant date is required in order for the PSUs to vest. The grant-date fair value of the PSUs was $429,293, or $3.61 per unit, using a Monte Carlo Simulation with a four-year life, 55% volatility and a risk free interest rate of 1.53%. The fair value of the PSUs is being recognized over the vesting period and $107,323 of compensation expense was recognized for these PSUs during the year ended December 31, 2016.
During the year ended December 31, 2015, the Company granted an employee 10,000 shares of restricted stock. The fair value of the restricted stock was $77,700 based on the closing market price of the Company’s stock on the date of grant, and is being recognized ratably over the four-year vesting period. Stock compensation expense of $19,425 and $7,284 related to this grant was recognized during the year ended December 31, 2016 and 2015, respectively. Shares outstanding at December 31, 2016 include 7,500 shares of unvested restricted stock. The Company is required to withhold income taxes at statutory rates based on the closing market value of the vested shares on the date of vesting. The Company offers the ability to have vested shares surrendered to the Company in an amount equal to the amount of taxes to be withheld. During the year ended December 31, 2016, the Company purchased 683 shares with a cost of $3,258 from an employee to cover federal and state taxes due.
As permitted by SAB 107, management utilizes the simplified approach to estimate the expected term of stock options, which represents the period of time that options granted are expected to be outstanding. The risk free interest rate for periods within the contractual life of the option is based on the U.S. treasury yield in effect at the time of grant. The volatility is estimated based on the historical volatilities of comparable companies. The Company has never declared or paid dividends and has no plans to do so in the foreseeable future.
The assumptions used in the Black-Scholes model are as follows:
|
| | | | | | |
| | For the year ended December 31, |
| | 2016 | | 2015 |
Average risk-free interest rate | | 1.55 | % | | 1.74 | % |
Expected dividend yield | | — | % | | — | % |
Expected life | | 5.31 to 6.25 years |
| | 5.31 to 6.25 years |
|
Expected volatility | | 55 | % | | 60 | % |
A summary of the Company’s stock option activity and related information is as follows:
|
| | | | | | | | | | | | | | | | | | |
| | 2016 | | 2015 |
| | Stock Options | | Weighted
Average
Exercise
Price | | Weighted
Average
Remaining
Life
(in years) | | Stock Options | | Weighted
Average
Exercise
Price | | Weighted
Average
Remaining
Life
(in years) |
Outstanding at January 1 | | 1,332,323 |
| | $ | 6.94 |
| | 8.4 | | 1,368,047 |
| | $ | 6.41 |
| | 8.7 |
Granted | | 96,138 |
| | $ | 5.95 |
| | | | 221,102 |
| | $ | 7.80 |
| | |
Exercised | | (4,607 | ) | | $ | 5.00 |
| | | | (201,389 | ) | | $ | 4.47 |
| | |
Forfeited/Expired/Exchanged | | (38,650 | ) | | $ | 6.68 |
| | | | (55,437 | ) | | $ | 6.13 |
| | |
Outstanding at December 31 | | 1,385,204 |
| | $ | 6.89 |
| | 7.5 | | 1,332,323 |
| | $ | 6.94 |
| | 8.4 |
Exercisable at December 31 | | 862,354 |
| | $ | 6.56 |
| | 7.2 | | 572,623 |
| | $ | 6.02 |
| | 7.8 |
During the year ended December 31, 2016, option holders exercised 4,607 options and paid the exercise price in cash. The Company received $23,035 in net cash proceeds for the exercise of options during 2016.
The following table sets forth additional information about stock options outstanding at December 31, 2016:
|
| | | | | | | | | | | | |
Range of Exercise Prices | | Options
Outstanding | | Weighted Average
Remaining Life
(in years) | | Weighted Average
Exercise Price | | Options
Exercisable |
$0.41 – $5.00 | | 100,738 |
| | 5.6 | | $ | 2.64 |
| | 72,638 |
|
$5.01 – $7.50 | | 634,428 |
| | 7.3 | | $ | 6.50 |
| | 464,803 |
|
$7.51 – $11.00 | | 650,038 |
| | 7.9 | | $ | 7.93 |
| | 324,913 |
|
| | 1,385,204 |
| | | | |
| | 862,354 |
|
The estimated aggregate pretax intrinsic value (the difference between the Company’s stock price on the last day of the year ended December 31, 2016 and the exercises price, multiplied by the number of vested in-the-money options) is approximately $92,186. This amount changes based on the fair value of the Company’s stock.
As of December 31, 2016, there was $2,609,715 of unrecognized compensation cost related to non-vested share-based compensation arrangements. That cost is expected to be recognized over a weighted average period of 2.2 years.
Note 11 — Warrants
During the year ended December 31, 2016, warrant holders exercised 5,753 warrants on a cashless basis and received 2,149 shares of common stock and 3,604 shares were used to cover the exercise price. In addition, warrant holders exercised 3,596 warrants and paid the exercise price in cash. The Company received $12,498 in net cash proceeds for the exercise of warrants during 2016.
During the year ended December 31, 2015, warrant holders exercised 127,340 warrants on a cashless basis and received 75,951 shares of common stock and 51,389 shares were used to cover the exercise price. In addition, a warrant holder exercised 28,766 warrants and paid the exercise price in cash. The Company received $99,957 in net cash proceeds for the exercise of warrants during 2015.
In 2013, the Company issued a warrant for the purchase of 84,000 shares of the Company’s common stock for consulting services, with an exercise price of $6.25. The warrant vested in increments beginning with November 2013 and ending with October 2015. The warrant was valued at $237,719 using the Black-Scholes option pricing model. For the years ended December 31, 2016 and 2015, the Company recorded $0 and $84,900, respectively, in expense related to the vested warrant.
The shares underlying the warrants have not been registered.
A summary of the Company’s warrant activity and related information is as follows:
|
| | | | | | | | | | | | | | |
| | 2016 | | 2015 |
| | Warrants | | Weighted
Average Exercise
Price | | Warrants | | Weighted
Average Exercise
Price |
Outstanding at January 1 | | 1,408,002 |
| | $ | 4.57 |
| | 1,564,108 |
| | $ | 4.48 |
|
Granted | | — |
| | — |
| | — |
| | — |
|
Exercised | | (9,349 | ) | | $ | 3.48 |
| | (156,106 | ) | | $ | 3.72 |
|
Forfeited/Expired | | — |
| | — |
| | — |
| | — |
|
Outstanding at December 31 | | 1,398,653 |
| | $ | 4.57 |
| | 1,408,002 |
| | $ | 4.57 |
|
No warrants were unvested at December 31, 2016.
Note 12 — Income Taxes
Income taxes are disproportionate to income due to net operating loss carryforwards, which are fully reserved. As of December 31, 2016, the Company has federal net operating loss carryforwards of approximately $33 million which will begin to expire in 2031. Management has concluded that it is more likely than not that the Company will not have sufficient foreseeable taxable income within the carryforward period permitted by current law to allow for the utilization of certain of the deductible amounts generating the deferred tax assets; therefore, a full valuation allowance has been established to reduce the net deferred tax assets to zero at December 31, 2016 and 2015.
The following is a summary of the significant components of the Company’s net deferred income tax assets and liabilities as of December 31, 2016 and 2015:
|
| | | | | | | | |
| | For the Year Ended December 31, |
| | 2016 | | 2015 |
Current deferred income tax assets: | | |
| | |
|
Inventory – uniform capitalization | | $ | 104,000 |
| | $ | 75,000 |
|
Accrued compensation and other | | 136,000 |
| | 199,000 |
|
Less: valuation allowance | | (240,000 | ) | | (274,000 | ) |
| | $ | — |
| | $ | — |
|
Non-current deferred income tax assets and (liabilities): | | |
| | |
|
Net operating loss | | $ | 11,319,000 |
| | $ | 8,029,000 |
|
Research and development credit | | 18,000 |
| | 18,000 |
|
Warranty reserve | | 114,000 |
| | 122,000 |
|
Warrants issued for services | | 73,000 |
| | 73,000 |
|
Depreciation and amortization | | 17,000 |
| | (12,000 | ) |
Exercise of options and warrants | | (50,000 | ) | | (46,000 | ) |
Stock based compensation | | 830,000 |
| | 511,000 |
|
Intangibles | | (666,000 | ) | | (548,000 | ) |
Less: valuation allowance | | (11,655,000 | ) | | (8,147,000 | ) |
Net non-current deferred tax assets | | $ | — |
| | $ | — |
|
The Company has applied the provisions of FASB ASC 740, Income Tax, which clarifies the accounting for uncertainty in tax positions. FASB ASC 740 requires the recognition of the impact of a tax position in the financial statements if that position is more likely than not of being sustained on a tax return upon examination by the relevant taxing authority, based on the technical merits of the position. At December 31, 2016 and 2015, the Company had no unrecognized tax benefits.
The Company recognizes interest and penalties related to income tax matters in interest expense and operating expenses, respectively. As of December 31, 2016 and 2015, the Company has no accrued interest and penalties related to uncertain tax positions.
The Company is subject to tax in the United States (“U.S.”) and files tax returns in the U.S. federal and certain state jurisdictions. The Company is no longer subject to U.S. federal, state and local income tax examinations by tax authorities for years before 2012. The Company currently is not under examination by any tax authority.
The reconciliation between the statutory income tax rate and the effective tax rate is as follows:
|
| | | | | | |
| | For the Year Ended
December 31, |
| | 2016 | | 2015 |
Statutory federal income tax rate | | (34 | )% | | (34 | )% |
Stock based compensation | | 2 |
| | (1 | ) |
Other | | — |
| | 2 |
|
Valuation allowance | | 32 |
| | 33 |
|
| | — | % | | — | % |
Note 13 — Commitments and Contingencies
Lease
The Company entered into a lease for 14,782 square feet of office and laboratory space located in Austin, Texas. The triple net lease has a term of 48 months and commenced on June 1, 2014. The annual base rent in the first year of the lease was $154,324 and increases by $3,548 in each succeeding year of the lease. In addition, the Company is required to pay its proportionate share of operating costs for the building. The Company has a one-time option to terminate the lease on May 31, 2017 with a termination payment of approximately $99,000 if it elects to exercise this option.
At December 31, 2016, the remaining annual base rent commitments under the lease, assuming no early termination, are as follows:
|
| | | |
For the year ended December 31, | Amount |
2017 | $ | 163,489 |
|
2018 | 68,736 |
|
Total | $ | 232,225 |
|
Rent expense incurred for the years ended December 31, 2016 and 2015 amounted to $224,308 and $212,397, respectively.
License Agreement
In 2015, the Company entered into licensing agreements which expire on February 7, 2033. Per the agreements, the Company has an exclusive royalty-free license associated with semiconductor power switches which enhances its intellectual property portfolio. The agreements include both fixed and variable payments. The variable payments are a function of the number of associated patent filings pending and patents issued under the agreements. The Company will pay $10,000 for each patent filing pending and $20,000 for each patent issued within 20 days of December 21, 2017 and each subsequent year of the agreement, up to a maximum of $100,000 per year (i.e. five issued patents).
In 2016, one patent associated with the agreements was issued. At December 31, 2016, the corresponding long-term liability for the estimated present value of future payments under the licensing agreement was $265,418. The Company is accruing interest for future payments related to the issued patent associated with the agreement. This long-term liability incurred in connection with the patent issuance is a non-cash investing activity with regard to the Company’s statements of cash flows. At December 31, 2016, no other patents associated with the agreements had been issued.
Note 14 — Retirement Plan
The Company has a defined contribution retirement plan covering all of its employees. Under the plan, Company contributions are discretionary. No discretionary contributions were made by the Company in the years ended December 31, 2016 and 2015.
Note 15 — Subsequent Events
On March 3, 2017, the Company closed on a definitive securities purchase agreement to sell the Company’s common stock and preferred stock together with warrants to purchase shares of common stock, or the Private Placement. In the Private Placement, each share of common stock or preferred stock was sold together with a warrant to purchase one share of common stock at a collective price of $2.535. Investors purchased an aggregate of 5,220,826 shares of common stock and 708,430 shares of preferred stock together with warrants to purchase 5,929,256 shares of common stock in the Private Placement for aggregate gross proceeds of approximately $15 million. The warrants have an exercise price of $2.41 per share, are non-exercisable for the first six months and will expire three years from the date of issuance. As part of the Private Placement, the Company committed to prepare and file with the SEC a Registration Statement on Form S-3 covering the resale of the registrable securities within 30 days of the closing date.
Net cash proceeds were approximately $13.6 million after offering fees and expenses, including the placement agent fee of approximately $1.1 million. The placement agent also received 237,170 warrants to purchase shares of common stock as part of its placement agent fee. The placement agent warrant has an exercise price of $2.89 per share, is non-exercisable for 12 months and has a three-year term. The Company expects to utilize net proceeds from the offering for working capital and general corporate purposes.
ITEM 9: CHANGES IN AND DISAGREEMENTS WITH ACCOUNTANTS ON ACCOUNTING AND FINANCIAL DISCLOSURE
Not applicable.
ITEM 9A: CONTROLS AND PROCEDURES
Disclosure controls and procedures include, without limitation, controls and procedures designed to ensure that information required to be disclosed by an issuer in the reports that it files or submits under the Securities Exchange Act of 1934, as amended (the “Act”) is accumulated and communicated to the issuer’s management, including its principal executive and principal financial officers, or persons performing similar functions, as appropriate to allow timely decisions regarding required disclosure.
We carried out an evaluation, under the supervision and with the participation of our management, including our Chief Executive Officer (“CEO”), our principal executive officer, and our Chief Financial Officer (“CFO”), our principal financial and accounting officer, of the effectiveness of the design and operation of our disclosure controls and procedures as of the end of the period covered by this report. The evaluation was undertaken in consultation with our accounting personnel. Based on that evaluation, our CEO and CFO concluded that our disclosure controls and procedures are effective to ensure that information required to be disclosed by us in the reports that we file or submit under the Securities Exchange Act of 1934 is recorded, processed, summarized and reported within the time periods specified in the Securities and Exchange Commission’s rules and forms.
Report on Internal Control over Financial Reporting
Our management is responsible for establishing and maintaining adequate internal control over financial reporting, as defined in Rules 13a-15(f) and 15d-15(f) under the Exchange Act. Internal control over financial reporting is a process designed by, or under the supervision of, our CEO and CFO and effected by our board of directors, management and other personnel, to provide reasonable assurance regarding the reliability of financial reporting and the preparation of financial statements for external purposes in accordance with generally accepted accounting principles. Our management, under the supervision and with the participation of our CEO and CFO, conducted an evaluation of the effectiveness of our internal control over financial reporting based on the framework in Internal Control — Integrated Framework (2013) issued by the Committee of Sponsoring Organizations (COSO). Based on such evaluation, management concluded that our internal control over financial reporting was effective as of December 31, 2016.
This Annual Report does not include an attestation report of our independent registered public accounting firm regarding internal control over financial reporting. Management’s report was not subject to attestation requirements by our independent registered public accounting firm pursuant to rules of the Securities and Exchange Commission that permit us to provide only management’s report in this Annual Report.
Changes in Internal Control over Financial Reporting
There were no changes in our internal control over financial reporting identified in management’s evaluation pursuant to Rule 13a-15(d) or 15d-15(d) of the Act during the three months ended December 31, 2016 that materially affected, or are reasonably likely to materially affect, our internal control over financial reporting.
Inherent Limitations on Effectiveness of Controls
Our management, including our CEO and CFO, do not expect that our disclosure controls or our internal control over financial reporting will prevent or detect all errors and all fraud. A control system, no matter how well designed and operated, can provide only reasonable, not absolute, assurance that the control system’s objectives will be met. The design of a control system must reflect the fact that there are resource constraints, and the benefits of controls must be considered relative to their costs. Further, because of the inherent limitations in all control systems, no evaluation of controls can provide absolute assurance that misstatements due to error or fraud will not occur or that all control issues and instances of fraud, if any, have been detected. These inherent limitations include the realities that judgments in decision-making can be faulty and that breakdowns can occur because of a simple error or mistake. Controls can also be circumvented by the individual acts of some persons, by collusion of two or more people, or by management override of the controls. The design of any system of controls is based in part on certain assumptions about the likelihood of future events, and there can be no assurance that any design will succeed in achieving its stated goals under all potential future conditions. Projections of any evaluation of control effectiveness
to future periods are subject to risks. Over time, controls may become inadequate because of changes in conditions or deterioration in the degree of compliance with policies or procedures.
ITEM 9B: OTHER INFORMATION
Not applicable.
PART III
ITEM 10: DIRECTORS, EXECUTIVE OFFICERS AND CORPORATE GOVERNANCE
The following table sets forth the names and ages of all of our directors and executive officers. Our officers are appointed by, and serve at the pleasure of, the board of directors.
|
| | | | |
Name | | Age | | Position |
R. Daniel Brdar | | 57 | | Chief Executive Officer, President and Director |
Timothy W. Burns, CPA | | 42 | | Chief Financial Officer, Secretary and Treasurer |
William C. Alexander | | 61 | | Chief Technology Officer and Director |
Ryan O’Keefe | | 49 | | Senior Vice President, Business Development |
Mark L. Baum, J.D. | | 44 | | Director |
Lon E. Bell, Ph.D. | | 76 | | Interim Chairman of the Board |
David B. Eisenhaure | | 71 | | Director |
The remaining information required by this item is incorporated herein by reference from our Definitive Proxy Statement, involving the election of directors, to be filed pursuant to Regulation 14A with the SEC not later than 120 days after the end of the fiscal year covered by this Form 10-K (or Definitive Proxy Statement).
ITEM 11: EXECUTIVE COMPENSATION
The information required by this item is incorporated by reference from our Definitive Proxy Statement.
ITEM 12: SECURITY OWNERSHIP OF CERTAIN BENEFICIAL OWNERS AND MANAGEMENT AND RELATED SHAREHOLDER MATTERS
Securities Authorized for Issuance under Equity Compensation Plans
The table below provides information, as of December 31, 2016, regarding the Plan under which our equity securities are authorized for issuance to officers, directors, employees, consultants, independent contractors and advisors.
|
| | | | | | | | | | | | | | |
Plan category | | Number of securities to be issued upon exercise of outstanding options, warrants and rights (a) | | | | Weighted-average exercise price of outstanding options, warrants and rights (b) | | Number of securities remaining available for future issuance under equity compensation plans (excluding securities reflected in column (a)) (c) | | |
Equity compensation plans approved by security holders | | 1,277,566 |
| | (1) | | $ | 7.16 |
| | 655,127 |
| | (2) |
| |
(1) | This amount includes PSUs granted to employees. |
| |
(2) | This amount will not be subject to future increases, absent shareholder approval of an increase in the securities authorized for issuance under the Plan. |
The rest of the information required by this item is incorporated by reference from our Definitive Proxy Statement.
ITEM 13: CERTAIN RELATIONSHIPS AND RELATED TRANSACTIONS, AND DIRECTOR INDEPENDENCE
The information required by this item is incorporated by reference from our Definitive Proxy Statement.
ITEM 14: PRINCIPAL ACCOUNTANT FEES AND SERVICES
The information required by this item is incorporated by reference from our Definitive Proxy Statement.
PART IV
ITEM 15: EXHIBITS AND FINANCIAL STATEMENT SCHEDULES
(a) Documents Filed with Report
(1) Financial Statements.
|
| |
Report of Independent Registered Accounting Firm | |
Balance Sheets as of December 31, 2015 and 2016 | |
Statements of Operations for the years ended December 31, 2016 and 2015 | |
Statement of Stockholders’ Equity for the years ended December 31, 2016 and 2015 | |
Statements of Cash Flows for the years ended December 31, 2016 and 2015 | |
(2) Exhibits.
The exhibits filed as part of this Annual Report on Form 10-K are listed in the Exhibit Index immediately preceding the exhibits. We have identified in the Exhibit Index each management contract and compensation plan filed as an exhibit to this Annual Report on Form 10-K in response to Item 15(a) (3) of Form 10-K.
ITEM 16: FORM 10-K SUMMARY
None.
SIGNATURES
Pursuant to the requirements of Section 13 or 15(d) of the Securities Exchange Act of 1934, the registrant has duly caused this report to be signed on its behalf by the undersigned, thereunto duly authorized, in the City of Austin, State of Texas, on this 29th day of March, 2017.
|
| | |
| IDEAL POWER INC. |
| |
| By: | /s/ R. Daniel Brdar |
| | R. Daniel Brdar, |
| | Chief Executive Officer |
| | |
| By: | /s/ Timothy Burns |
| | Timothy Burns, |
| | Chief Financial Officer |
Pursuant to the requirements of the Securities Exchange Act of 1934, this report has been signed below by the following persons on behalf of the registrant and in the capacities and on the dates indicated.
|
| |
Dated: March 29, 2017 | /s/ R. Daniel Brdar |
| R. Daniel Brdar, |
| Chief Executive Officer |
| (principal executive officer), |
| President and director |
| |
Dated: March 29, 2017 | /s/ Timothy Burns |
| Timothy Burns, |
| Chief Financial Officer |
| (principal financial and accounting officer), |
| Secretary and Treasurer |
| |
Dated: March 29, 2017 | /s/ William Alexander |
| William C. Alexander, |
| Chief Technology Officer and director |
| |
Dated: March 29, 2017 | /s/ Lon Bell |
| Lon E. Bell, Ph.D., interim chairman of the board |
| |
Dated: March 29, 2017 | /s/ Mark Baum |
| Mark L. Baum, director |
| |
Dated: March 29, 2017 | /s/ David Eisenhaure |
| David B. Eisenhaure, director |
| |
EXHIBIT INDEX
|
| | |
Exhibit No. | | Description of Document |
3.1 | | Delaware Certificate of Conversion including Certificate of Incorporation (1) |
3.2 | | Bylaws of Ideal Power Inc. (1) |
4.1 | | Underwriter’s Warrant (1) |
10.1 | | Form of Lock-Up Agreement (1) |
10.2 | | Form of Warrant issued by the registrant to investors in the offering completed on July 17, 2012 (1) |
10.3 | | Form of Warrant issued by the registrant to investors in the offering completed on August 31, 2012 (1) |
10.4 | | Form of Replacement Warrant issued by the registrant to investors in the offering completed on August 31, 2012 (1) |
10.5 | | Form of Warrant issued by the registrant to investors in the offering completed on November 21, 2012 (1) |
10.6 | | Warrant issued to MDB Capital Group, LLC (MDB-1) dated November 21, 2012 (1) |
10.7 | | Warrant issued to MDB Capital Group, LLC (MDB-2) dated November 21, 2012 (1) |
10.8 | | Form of Warrant issued by the registrant to investors in the offering completed on July 29, 2013 (1) |
10.9 | | Ideal Power Inc. 2013 Amended and Restated Equity Incentive Plan (5) |
10.10 | | Addendum to Warrant issued to MDB Capital Group, LLC (MDB-1) dated July 10, 2013 (1) |
10.11 | | Addendum to Warrant issued to MDB Capital Group, LLC (MDB-2) dated July 10, 2013 (1) |
10.12 | | Form of Addendum to Stock Purchase Warrant (Series A) (1) |
10.13 | | Form of Addendum to Stock Purchase Warrant (Series B) (1) |
10.14 | | Employment Agreement between the registrant and R. Daniel Brdar (2) + |
10.14.1 | | Amendment No. 1 to Employment Agreement between the registrant and R. Daniel Brdar dated September 16, 2014(4) + |
10.15 | | Non-Qualified Stock Option Award Agreement issued to R. Daniel Brdar (2) + |
10.16 | | Lease Agreement between the Company and Agellan Commercial REIT U.S. L.P. dated March 24, 2014 (3) |
10.17 | | Employment Agreement between the Company and William Alexander dated September 16, 2014 (4) + |
10.18 | | Employment Agreement between the registrant and Timothy W. Burns dated September 16, 2014 (4) + |
10.19 | | Employment Agreement between the registrant and Ryan O’Keefe dated August 11, 2014 (6) + |
31.1 | | Certification of Principal Executive Officer, pursuant to Rule 13a-14(a) or 15d-14(a) of the Securities and Exchange Act of 1934, as adopted pursuant to Section 302 of the Sarbanes-Oxley Act of 2002* |
31.2 | | Certification of Principal Financial and Accounting Officer pursuant to Rule 13a-14(a) or 15d-14(a) of the Securities and Exchange Act of 1934, as adopted pursuant to Section 302 of the Sarbanes-Oxley Act of 2002* |
32.1 | | Certification of Principal Executive Officer and Principal Financial and Accounting Officer pursuant to 18 U.S.C. Section 1350, as adopted pursuant to Section 906 of the Sarbanes-Oxley Act of 2002* |
101.INS | | XBRL Instance Document* |
101.SCH | | XBRL Taxonomy Extension Schema* |
101.CAL | | XBRL Taxonomy Extension Calculation Linkbase* |
101.DEF | | XBRL Taxonomy Extension Definition Linkbase* |
101.LAB | | XBRL Taxonomy Extension Label Linkbase* |
101.PRE | | XBRL Taxonomy Extension Presentation Linkbase* |
|
| |
* | Included herein. |
+ | Indicates a contract with management. |
| |
(1) | Incorporated by reference to the registrant’s registration statement on Form S-1, file no. 333-190414, originally filed with the Securities and Exchange Commission on August 6, 2013, as amended. |
| |
(2) | Incorporated by reference to the registrant’s Current Report on Form 8-K filed with the Securities and Exchange Commission on January 8, 2014. |
| |
(3) | Incorporated by reference to the registrant’s Annual Report on Form 10-K filed with the Securities and Exchange Commission on March 28, 2014. |
| |
(4) | Incorporated by reference to the registrant’s Current Report on Form 8-K filed with the Securities and Exchange Commission on September 19, 2014. |
| |
(5) | Incorporated by reference to the registrant’s Quarterly Report on Form 10-Q filed with the Securities and Exchange Commission on November 13, 2015. |
| |
(6) | Incorporated by reference to the registrant’s Annual Report on Form 10-K filed with the Securities and Exchange Commission on March 30, 2016. |